<?xml version="1.0" encoding="utf-8"?><feed xmlns="http://www.w3.org/2005/Atom" ><generator uri="https://jekyllrb.com/" version="3.10.0">Jekyll</generator><link href="https://cduvallet.github.io/feed.xml" rel="self" type="application/atom+xml" /><link href="https://cduvallet.github.io/" rel="alternate" type="text/html" /><updated>2026-03-19T10:54:29-07:00</updated><id>https://cduvallet.github.io/feed.xml</id><title type="html">Claire Duvallet</title><subtitle>Claire Duvallet</subtitle><author><name>Claire Duvallet</name><email>cduvallet@gmail.com</email></author><entry><title type="html">Becoming ‘tourist fluent’ in a new language</title><link href="https://cduvallet.github.io/posts/2026/03/tourist-fluent" rel="alternate" type="text/html" title="Becoming ‘tourist fluent’ in a new language" /><published>2026-03-19T00:00:00-07:00</published><updated>2026-03-19T00:00:00-07:00</updated><id>https://cduvallet.github.io/posts/2026/03/tourist-fluent</id><content type="html" xml:base="https://cduvallet.github.io/posts/2026/03/tourist-fluent"><![CDATA[<p>One of my favorite parts of living in Cambodia was learning the language. It unlocked a way of traveling and connecting with locals that was so special and fun, transforming even the most mundane moments into opportunities to smile and connect. That year, I took a lot of short trips to other countries, often where I had friends on my same fellowship who had also learned their country’s language.</p>

<p>By the end of my year, I had arrived at a solid and minimal set of words that I learned when I arrived in a new place which let me not only navigate the world as a tourist, but also imbued my experiences with the joy of discovering other cultures and connecting with other humans.</p>

<p>I still kick myself that I didn’t write them down when they were fresh, but 12 years late is better than never, right? Here’s what I remember:</p>

<p><strong>This</strong> and <strong>that</strong> are truly the most versatile of words. Combined with pointing, you can use these to navigate shopping experiences at a market, figure out where you need to go, and so much more.</p>

<p><strong>Here</strong>, <strong>there</strong>, and <strong>over there</strong>. Also critical for helping you find your way. Learn the different ways to indicate distance, but recognize that you can do a lot with inflection. The difference between there (just  there) and there (waaaaay over there) can simply be how you say the word “there” and what your face is doing.</p>

<p><strong>Already</strong> turns any word or phrase into past tense.</p>

<p>These words plus a few key nouns will get you 80% of what you need to get around as a tourist. For example:</p>
<ul>
  <li>“Is this the bus stop?” –&gt; “Bus here?” / “No? Bus there?”</li>
  <li>“Did I miss the bus?” –&gt; “Bus already?”</li>
  <li>Ordering food or buying things –&gt; just point and say “this” or “that” rather than having to learn the words for every type of food.</li>
</ul>

<p>Also some of the other basics:</p>

<ul>
  <li><strong>Hello</strong>: It’s nice to say hello in the language when you enter an establishment, to at least indicate that you are willing to muddle through communication and not just expecting them to know perfect English. In many languages, there’s a different way to say “hello” when you enter an establishment that is slightly more formal than how you’d say hello to a friend. It’s worth knowing the difference but don’t stress about it, either one conveys the message the same: I’m here and I’m making an effort to connect.</li>
  <li><strong>Thank you</strong>: it’s also nice to say thank you in their language, even if your whole interaction was in English.</li>
  <li>Basic <strong>time</strong> and <strong>numbers</strong>, especially as they relate to money.</li>
  <li><strong>Where</strong> and <strong>when</strong> are useful in part because you’ll probably be able to understand the answer. “When” or “what time” can also be used to ask when something opens: <em>point to a closed establishment</em> “what time?”</li>
  <li><strong>Have</strong>: useful to help you find what you need. For example, “do you have X” can just be phrased as “have X?” Or you can use it to fend off people trying to sell you things with a quick “have already”.</li>
  <li><strong>Go</strong>: useful to get around, so you can ask for example “does the bus go to X?” (“bus go X?”)</li>
  <li><strong>How much</strong> and <strong>expensive</strong>: useful to navigate markets, shopping, and negotiating. It’s important also to learn the inflections that turn “expensive” from a confrontational word to one that is more fun and friendly. You want to go for “wooooof, expensive ruh roh” rather than “ugh that is too expensive I’m leaving” so that there’s an opening for negotiation.</li>
  <li><strong>Sorry</strong>: learn the word for a low-key apology, for example what you’d say when bump into people in the subway. Also useful when you make a fool or yourself as the tourist buffoon that you are.</li>
  <li><strong>Excuse me</strong>: most languages have a phrase or way to get people’s attention. Learn what this is to get better service at shops and restaurants, and also show that you did your basic research into local customs rather than just copy-paste translating from English.</li>
  <li><strong>Please</strong>: a short workaround to having to learn how to ask for something. Instead of saying “could I have X?” you can usually just get away with “please X” – adding the please lets you keep it short without sounding like a demanding douche.</li>
  <li><strong>Yes</strong> and <strong>no</strong>, self-explanatory.</li>
  <li>Also make sure to learn some critical nouns like: bathroom, hotel, food, bus/train/taxi/whatever transportation you’ll use, water, etc.</li>
</ul>

<p>The best part of becoming tourist fluent, though, is how few words it takes to connect with people:</p>

<ul>
  <li><strong>Let’s go</strong>: every language has a way to say “let’s go!” This is great to deploy on a tour or in a group of people. It’s also a good way to express enthusiasm about something someone is telling you about - rather than having to learn to say “oh my gosh that sounds amazing I want to go,” you can just say “let’s go!” and they will get the gist of your excitement. (This is my favorite one to learn.)</li>
  <li><strong>Delicious</strong>: Saying that the food is delicious is a great way to move your relationship with food service staff from transactional to connection. Connecting over food is a deeply human experience, knowing how to do so will inject small moments of joy into every part of your trip.
    <ul>
      <li>“How’s the food?” “Delicious!” <em>big smiles</em></li>
      <li>“What would you like to eat?” “Delicious!” (AKA: “something delicious please” / “what’s your favorite thing?”)</li>
      <li><em>At a street market faced with many unknown foods</em>: you can just point and ask “Delicious?” to find your best meal of the trip.</li>
    </ul>
  </li>
  <li><strong>Beautiful</strong>: People also love being complimented on the beauty of their country. Make sure you learn the word for an object that is beautiful rather than a person. Nothing weirder than calling a mountain sexy (but also, a great way to connect through laughter so go for it).</li>
  <li><strong>One more</strong>: as in, “one more beer please.” Crucial for if you find yourself drinking with locals, and another fun way to connect with wait staff. Can also be used to buy another round of drinks for said group of locals, point at each person and ask “One more?” until everyone joyfully agrees.</li>
  <li><strong>No worries</strong>: a great way to express that you’re here on vacation and interested in having a good time. Delayed bus? No worries. Item too expensive and negotiations have broken down? No worries. Restaurant is out of a food you ordered? No worries.</li>
  <li>If it’s a holiday, learn whatever the phrase is for that holiday. My favorite New Year’s Eve was at a fish farm / beer garden in northern Thailand. It took us a really long time to communicate “how do you say Happy New Year?” but once we broke through, the rest of the night was full of joyful “sabbai dee pi mai!” It was the only thing we really knew how to say in Thai and yet was enough to make for one of the most fun nights of our trip.</li>
  <li><strong>How do you say?</strong>: the phrase that keeps on giving.</li>
  <li><strong>I don’t understand</strong> / <strong>I don’t speak</strong>: very useful when your tourist fluency gets you in too deep!</li>
</ul>

<p>I’m sure I’m missing many, but this is at least a good start! Go forth and become tourist fluent, and report back what else you found useful. :)</p>

<p><em>Thanks to my friend Rose for co-brainstorming this list with me!</em></p>

<p><em>Edit: woops, looks like <a href="/posts/2019/04/tourist-fluent">I’ve already written about this before</a>! Ah well, it was a fun refresher.</em></p>]]></content><author><name>Claire Duvallet</name><email>cduvallet@gmail.com</email></author><summary type="html"><![CDATA[One of my favorite parts of living in Cambodia was learning the language. It unlocked a way of traveling and connecting with locals that was so special and fun, transforming even the most mundane moments into opportunities to smile and connect. That year, I took a lot of short trips to other countries, often where I had friends on my same fellowship who had also learned their country’s language.]]></summary></entry><entry><title type="html">Thank you for 18 years of DVDs, Netflix</title><link href="https://cduvallet.github.io/posts/2023/04/netflix-dvds" rel="alternate" type="text/html" title="Thank you for 18 years of DVDs, Netflix" /><published>2023-04-22T00:00:00-07:00</published><updated>2023-04-22T00:00:00-07:00</updated><id>https://cduvallet.github.io/posts/2023/04/netflix-dvd-history</id><content type="html" xml:base="https://cduvallet.github.io/posts/2023/04/netflix-dvds"><![CDATA[<p>Soon, Netflix <a href="https://www.npr.org/2023/04/18/1170740799/netflix-ends-dvd-by-mail-service">will be canceling</a> its DVD-by-mail program, the original service that helped Netflix crush Blockbuster and got us used to watching movies on-demand from the comfort of our homes before streaming was a thing. Perhaps not coincidentally, my dad cancelled my family’s subscription to the DVD service this winter. As my brother wisely put it upon hearing my dad’s news, “Netflix can finally stop buying physical DVDs now that their last customer cancelled!”</p>

<p>Of course, when I saw that Netflix had kept my parents’ entire DVD history I knew I <em>had</em> to look at the data. According to the history, my family signed up for Netflix in 2004 - that’s almost 20 years of DVDs! For most of that time, we were on a plan that let us have 3 DVDs concurrently. At some point while I was in high school, I was given full control over one of the 3 DVDs on our plan. Looking at the DVD history, though, this must have been before Netflix even had the concept of separate accounts - my Netflix account on my family’s plan only shows ~10 DVD rentals, but I distinctly remember years of freedom to discover indie movies and curl up in our game room watching movies on my own in high school. It was such a treat to have my own stream of movies that I had full control over. In fact, I still really miss watching indie movies and discovering other excellent movies from their trailers - Netflix’s algorithm really hasn’t figured me out as well as those trailers had.</p>

<h2 id="getting-the-data">Getting the data</h2>

<p>Anyway, onto the data. When you log in to dvd.netflix.com (a separate website from netlix.com, lol), the history is very simply shown in a table.</p>

<p>I didn’t see any easy way to just export this table, and I didn’t really want to try too hard to find a legit way to scrape the site (especially since I figured there’d be complex auth to get around), so I started with the good ol’ “inspect page” method. (Actually, I started with copy-paste but that didn’t work.) Turns out the information was easily accessible in the html page itself, so I went ahead and just downloaded the html pages for my mom and dad’s account histories. My parents started each using their own account to rent DVD’s, once the concept of accounts was implemented, and my dad’s account had about 500 entries on it so I figured it might have different movies on it.</p>

<p>With a combination of BeautifulSoup’s documentation, poking around via Chrome’s inspect tool, and good ol’ ctrl-F, I was able to pretty easily figure out how to extract all the information I needed.</p>

<div class="language-python highlighter-rouge"><div class="highlight"><pre class="highlight"><code><span class="kn">from</span> <span class="nn">bs4</span> <span class="kn">import</span> <span class="n">BeautifulSoup</span>
<span class="kn">import</span> <span class="nn">pandas</span> <span class="k">as</span> <span class="n">pd</span>

<span class="kn">import</span> <span class="nn">calmap</span>

<span class="kn">import</span> <span class="nn">matplotlib.pyplot</span> <span class="k">as</span> <span class="n">plt</span>
</code></pre></div></div>

<div class="language-python highlighter-rouge"><div class="highlight"><pre class="highlight"><code><span class="k">def</span> <span class="nf">extract_one_movie_info</span><span class="p">(</span><span class="n">m</span><span class="p">):</span>
    <span class="s">"""m is a BeautifulSoup object with one movie's row of info"""</span>
    <span class="n">position</span> <span class="o">=</span> <span class="n">m</span><span class="p">.</span><span class="n">find</span><span class="p">(</span><span class="s">'div'</span><span class="p">,</span> <span class="s">'position'</span><span class="p">).</span><span class="n">text</span>

    <span class="n">title</span> <span class="o">=</span> <span class="n">m</span><span class="p">.</span><span class="n">find</span><span class="p">(</span><span class="s">'a'</span><span class="p">,</span> <span class="s">'title'</span><span class="p">).</span><span class="n">string</span>

    <span class="c1"># year, rating, and duration
</span>    <span class="n">meta</span> <span class="o">=</span> <span class="n">m</span><span class="p">.</span><span class="n">find</span><span class="p">(</span><span class="s">'p'</span><span class="p">,</span> <span class="s">'metadata'</span><span class="p">)</span>
    <span class="n">year</span><span class="p">,</span> <span class="n">movie_rating</span><span class="p">,</span> <span class="n">duration</span> <span class="o">=</span> <span class="p">[</span><span class="n">x</span><span class="p">.</span><span class="n">text</span> <span class="k">for</span> <span class="n">x</span> <span class="ow">in</span> <span class="n">meta</span><span class="p">.</span><span class="n">find_all</span><span class="p">(</span><span class="s">'span'</span><span class="p">)]</span>

    <span class="c1"># get the ratings
</span>    <span class="n">user_rating</span> <span class="o">=</span> <span class="n">m</span><span class="p">.</span><span class="n">find</span><span class="p">(</span><span class="s">'span'</span><span class="p">,</span>  <span class="n">attrs</span><span class="o">=</span><span class="p">{</span><span class="s">'data-userrating'</span><span class="p">:</span> <span class="bp">True</span><span class="p">}).</span><span class="n">attrs</span><span class="p">[</span><span class="s">'data-userrating'</span><span class="p">]</span>
    <span class="n">avg_rating</span> <span class="o">=</span> <span class="n">m</span><span class="p">.</span><span class="n">find</span><span class="p">(</span><span class="s">'span'</span><span class="p">,</span>  <span class="n">attrs</span><span class="o">=</span><span class="p">{</span><span class="s">'data-userrating'</span><span class="p">:</span> <span class="bp">True</span><span class="p">}).</span><span class="n">attrs</span><span class="p">[</span><span class="s">'data-rating'</span><span class="p">]</span>

    <span class="n">ship_date</span> <span class="o">=</span> <span class="n">m</span><span class="p">.</span><span class="n">find</span><span class="p">(</span><span class="s">'div'</span><span class="p">,</span> <span class="s">'shipped'</span><span class="p">).</span><span class="n">text</span>
    <span class="n">return_date</span> <span class="o">=</span> <span class="n">m</span><span class="p">.</span><span class="n">find</span><span class="p">(</span><span class="s">'div'</span><span class="p">,</span> <span class="s">'returned'</span><span class="p">).</span><span class="n">text</span>

    <span class="k">return</span> <span class="p">(</span>
        <span class="n">position</span><span class="p">,</span>
        <span class="p">{</span>
            <span class="s">'title'</span><span class="p">:</span> <span class="n">title</span><span class="p">,</span>
            <span class="s">'year_or_season'</span><span class="p">:</span> <span class="n">year</span><span class="p">,</span>
            <span class="s">'movie_rating'</span><span class="p">:</span> <span class="n">movie_rating</span><span class="p">,</span>
            <span class="s">'disc_or_duration'</span><span class="p">:</span> <span class="n">duration</span><span class="p">,</span>
            <span class="s">'user_rating'</span><span class="p">:</span> <span class="n">user_rating</span><span class="p">,</span>
            <span class="s">'avg_rating'</span><span class="p">:</span> <span class="n">avg_rating</span><span class="p">,</span>
            <span class="s">'ship_date'</span><span class="p">:</span> <span class="n">ship_date</span><span class="p">,</span>
            <span class="s">'return_date'</span><span class="p">:</span> <span class="n">return_date</span>
        <span class="p">}</span>
    <span class="p">)</span>

<span class="k">def</span> <span class="nf">extract_movie_dict</span><span class="p">(</span><span class="n">soup</span><span class="p">):</span>
    <span class="s">"""soup is the parsed html containing the full DVD history.
    Returns a dict where the key is the position of the movie (i.e. row number)
    """</span>

    <span class="c1"># There should only be two tags with these, one with the full table of info and
</span>    <span class="c1"># one with some placeholder code that I'm assuming populates the front-end somehow
</span>    <span class="n">hist</span> <span class="o">=</span> <span class="n">soup</span><span class="p">.</span><span class="n">find_all</span><span class="p">(</span><span class="s">'div'</span><span class="p">,</span> <span class="nb">id</span><span class="o">=</span><span class="s">'historyList'</span><span class="p">)[</span><span class="mi">0</span><span class="p">]</span>

    <span class="c1"># Get all of the movie elements, they're in a &lt;li&gt; &lt;/li&gt; blocks woohoo!
</span>    <span class="n">movies</span> <span class="o">=</span> <span class="n">hist</span><span class="p">.</span><span class="n">find_all</span><span class="p">(</span><span class="s">'li'</span><span class="p">,</span> <span class="nb">id</span><span class="o">=</span><span class="bp">True</span><span class="p">)</span>

    <span class="n">movie_dict</span> <span class="o">=</span> <span class="nb">dict</span><span class="p">([</span><span class="n">extract_one_movie_info</span><span class="p">(</span><span class="n">m</span><span class="p">)</span> <span class="k">for</span> <span class="n">m</span> <span class="ow">in</span> <span class="n">movies</span><span class="p">])</span>

    <span class="k">return</span> <span class="n">movie_dict</span>
</code></pre></div></div>

<div class="language-python highlighter-rouge"><div class="highlight"><pre class="highlight"><code><span class="k">with</span> <span class="nb">open</span><span class="p">(</span><span class="s">'DVD Netflix-Alain.html'</span><span class="p">,</span> <span class="s">'r'</span><span class="p">)</span> <span class="k">as</span> <span class="n">f1</span><span class="p">:</span>
    <span class="n">soup1</span> <span class="o">=</span> <span class="n">BeautifulSoup</span><span class="p">(</span><span class="n">f1</span><span class="p">,</span> <span class="s">'html.parser'</span><span class="p">)</span>

<span class="n">dad_dict</span> <span class="o">=</span> <span class="n">extract_movie_dict</span><span class="p">(</span><span class="n">soup1</span><span class="p">)</span>

<span class="k">with</span> <span class="nb">open</span><span class="p">(</span><span class="s">'DVD Netflix-Nadine.html'</span><span class="p">,</span> <span class="s">'r'</span><span class="p">)</span> <span class="k">as</span> <span class="n">f2</span><span class="p">:</span>
    <span class="n">soup2</span> <span class="o">=</span> <span class="n">BeautifulSoup</span><span class="p">(</span><span class="n">f2</span><span class="p">,</span> <span class="s">'html.parser'</span><span class="p">)</span>

<span class="n">mom_dict</span> <span class="o">=</span> <span class="n">extract_movie_dict</span><span class="p">(</span><span class="n">soup2</span><span class="p">)</span>

<span class="k">assert</span> <span class="nb">len</span><span class="p">(</span><span class="n">dad_dict</span><span class="p">)</span> <span class="o">==</span> <span class="mi">508</span>
<span class="k">assert</span> <span class="nb">len</span><span class="p">(</span><span class="n">mom_dict</span><span class="p">)</span> <span class="o">==</span> <span class="mi">1598</span>
</code></pre></div></div>

<div class="language-python highlighter-rouge"><div class="highlight"><pre class="highlight"><code><span class="c1"># | operator is new in python 3.9: https://docs.python.org/3/library/stdtypes.html#mapping-types-dict
</span><span class="n">movie_dict</span> <span class="o">=</span> <span class="p">{</span><span class="s">'mom_'</span> <span class="o">+</span> <span class="n">k</span><span class="p">:</span> <span class="n">v</span> <span class="k">for</span> <span class="n">k</span><span class="p">,</span><span class="n">v</span> <span class="ow">in</span> <span class="n">mom_dict</span><span class="p">.</span><span class="n">items</span><span class="p">()}</span> <span class="o">|</span> <span class="p">{</span><span class="s">'dad_'</span> <span class="o">+</span> <span class="n">k</span><span class="p">:</span> <span class="n">v</span> <span class="k">for</span> <span class="n">k</span><span class="p">,</span><span class="n">v</span> <span class="ow">in</span> <span class="n">dad_dict</span><span class="p">.</span><span class="n">items</span><span class="p">()}</span>

<span class="c1"># make sure we didn't drop any keys
</span><span class="k">assert</span> <span class="nb">len</span><span class="p">(</span><span class="n">movie_dict</span><span class="p">)</span> <span class="o">==</span> <span class="nb">len</span><span class="p">(</span><span class="n">dad_dict</span><span class="p">)</span> <span class="o">+</span> <span class="nb">len</span><span class="p">(</span><span class="n">mom_dict</span><span class="p">)</span>
</code></pre></div></div>

<div class="language-python highlighter-rouge"><div class="highlight"><pre class="highlight"><code><span class="n">df</span> <span class="o">=</span> <span class="n">pd</span><span class="p">.</span><span class="n">DataFrame</span><span class="p">(</span><span class="n">movie_dict</span><span class="p">).</span><span class="n">T</span>
<span class="n">df</span><span class="p">.</span><span class="n">head</span><span class="p">()</span>
</code></pre></div></div>

<div>
<style scoped="">
    .dataframe tbody tr th:only-of-type {
        vertical-align: middle;
    }

    .dataframe tbody tr th {
        vertical-align: top;
    }

    .dataframe thead th {
        text-align: right;
    }
</style>
<table border="1" class="dataframe">
  <thead>
    <tr style="text-align: right;">
      <th></th>
      <th>title</th>
      <th>year_or_season</th>
      <th>movie_rating</th>
      <th>disc_or_duration</th>
      <th>user_rating</th>
      <th>avg_rating</th>
      <th>ship_date</th>
      <th>return_date</th>
    </tr>
  </thead>
  <tbody>
    <tr>
      <th>mom_1</th>
      <td>Daughters of the Dust</td>
      <td>1991</td>
      <td>NR</td>
      <td>1h 53m</td>
      <td>0</td>
      <td>3</td>
      <td>12/05/22</td>
      <td>Returned 12/29/22</td>
    </tr>
    <tr>
      <th>mom_2</th>
      <td>I Vitelloni</td>
      <td>1953</td>
      <td>NR</td>
      <td>1h 43m</td>
      <td>0</td>
      <td>4</td>
      <td>11/23/22</td>
      <td>Returned 12/05/22</td>
    </tr>
    <tr>
      <th>mom_3</th>
      <td>Mutiny on the Bounty</td>
      <td>1935</td>
      <td>NR</td>
      <td>2h 12m</td>
      <td>0</td>
      <td>3.9</td>
      <td>11/18/22</td>
      <td>Returned 11/23/22</td>
    </tr>
    <tr>
      <th>mom_4</th>
      <td>The Pervert's Guide to Ideology</td>
      <td>2012</td>
      <td>NR</td>
      <td>2h 16m</td>
      <td>0</td>
      <td>3.7</td>
      <td>10/04/22</td>
      <td>Returned 11/17/22</td>
    </tr>
    <tr>
      <th>mom_5</th>
      <td>Diabolically Yours / The Widow Couderc</td>
      <td>1967</td>
      <td>NR</td>
      <td>3h 2m</td>
      <td>0</td>
      <td>3.3</td>
      <td>09/27/22</td>
      <td>Returned 10/04/22</td>
    </tr>
  </tbody>
</table>
</div>

<div class="language-python highlighter-rouge"><div class="highlight"><pre class="highlight"><code><span class="n">df</span><span class="p">[</span><span class="s">'user_rating'</span><span class="p">]</span> <span class="o">=</span> <span class="n">df</span><span class="p">[</span><span class="s">'user_rating'</span><span class="p">].</span><span class="n">astype</span><span class="p">(</span><span class="nb">float</span><span class="p">)</span>
<span class="n">df</span><span class="p">[</span><span class="s">'avg_rating'</span><span class="p">]</span> <span class="o">=</span> <span class="n">df</span><span class="p">[</span><span class="s">'avg_rating'</span><span class="p">].</span><span class="n">astype</span><span class="p">(</span><span class="nb">float</span><span class="p">)</span>

<span class="c1"># Some more parsing to get the dates right
</span><span class="n">df</span><span class="p">[</span><span class="s">'ship_date'</span><span class="p">]</span> <span class="o">=</span> <span class="n">pd</span><span class="p">.</span><span class="n">to_datetime</span><span class="p">(</span><span class="n">df</span><span class="p">[</span><span class="s">'ship_date'</span><span class="p">],</span> <span class="nb">format</span><span class="o">=</span><span class="s">'%m/%d/%y'</span><span class="p">)</span>
<span class="n">df</span><span class="p">[</span><span class="s">'return_date'</span><span class="p">]</span> <span class="o">=</span> <span class="n">pd</span><span class="p">.</span><span class="n">to_datetime</span><span class="p">(</span><span class="n">df</span><span class="p">[</span><span class="s">'return_date'</span><span class="p">].</span><span class="nb">str</span><span class="p">.</span><span class="n">split</span><span class="p">(</span><span class="s">' '</span><span class="p">).</span><span class="nb">str</span><span class="p">[</span><span class="mi">1</span><span class="p">],</span> <span class="nb">format</span><span class="o">=</span><span class="s">'%m/%d/%y'</span><span class="p">)</span>

<span class="n">df</span><span class="p">.</span><span class="n">head</span><span class="p">()</span>
</code></pre></div></div>

<div>
<style scoped="">
    .dataframe tbody tr th:only-of-type {
        vertical-align: middle;
    }

    .dataframe tbody tr th {
        vertical-align: top;
    }

    .dataframe thead th {
        text-align: right;
    }
</style>
<table border="1" class="dataframe">
  <thead>
    <tr style="text-align: right;">
      <th></th>
      <th>title</th>
      <th>year_or_season</th>
      <th>movie_rating</th>
      <th>disc_or_duration</th>
      <th>user_rating</th>
      <th>avg_rating</th>
      <th>ship_date</th>
      <th>return_date</th>
    </tr>
  </thead>
  <tbody>
    <tr>
      <th>mom_1</th>
      <td>Daughters of the Dust</td>
      <td>1991</td>
      <td>NR</td>
      <td>1h 53m</td>
      <td>0.0</td>
      <td>3.0</td>
      <td>2022-12-05</td>
      <td>2022-12-29</td>
    </tr>
    <tr>
      <th>mom_2</th>
      <td>I Vitelloni</td>
      <td>1953</td>
      <td>NR</td>
      <td>1h 43m</td>
      <td>0.0</td>
      <td>4.0</td>
      <td>2022-11-23</td>
      <td>2022-12-05</td>
    </tr>
    <tr>
      <th>mom_3</th>
      <td>Mutiny on the Bounty</td>
      <td>1935</td>
      <td>NR</td>
      <td>2h 12m</td>
      <td>0.0</td>
      <td>3.9</td>
      <td>2022-11-18</td>
      <td>2022-11-23</td>
    </tr>
    <tr>
      <th>mom_4</th>
      <td>The Pervert's Guide to Ideology</td>
      <td>2012</td>
      <td>NR</td>
      <td>2h 16m</td>
      <td>0.0</td>
      <td>3.7</td>
      <td>2022-10-04</td>
      <td>2022-11-17</td>
    </tr>
    <tr>
      <th>mom_5</th>
      <td>Diabolically Yours / The Widow Couderc</td>
      <td>1967</td>
      <td>NR</td>
      <td>3h 2m</td>
      <td>0.0</td>
      <td>3.3</td>
      <td>2022-09-27</td>
      <td>2022-10-04</td>
    </tr>
  </tbody>
</table>
</div>

<h2 id="how-many-movies-did-we-rent-but-first-a-lot-of-data-cleaning">How many movies did we rent? (But first: a lot of data cleaning)</h2>

<p>First, let’s get some summary statistics about how many movies we rented, and if any of those rentals were of movies we had already rented.</p>

<p>But before I can do that, I need to make sure that all the movies in my dataset are unique.</p>

<div class="language-python highlighter-rouge"><div class="highlight"><pre class="highlight"><code><span class="c1"># Are all movies unique?
</span><span class="n">df</span><span class="p">.</span><span class="n">groupby</span><span class="p">(</span><span class="s">'title'</span><span class="p">).</span><span class="nb">filter</span><span class="p">(</span><span class="k">lambda</span> <span class="n">x</span><span class="p">:</span> <span class="nb">len</span><span class="p">(</span><span class="n">x</span><span class="p">[</span><span class="s">'title'</span><span class="p">])</span> <span class="o">&gt;</span> <span class="mi">1</span><span class="p">).</span><span class="n">sort_values</span><span class="p">(</span><span class="n">by</span><span class="o">=</span><span class="s">'title'</span><span class="p">).</span><span class="n">head</span><span class="p">(</span><span class="mi">20</span><span class="p">)</span>
</code></pre></div></div>

<div>
<style scoped="">
    .dataframe tbody tr th:only-of-type {
        vertical-align: middle;
    }

    .dataframe tbody tr th {
        vertical-align: top;
    }

    .dataframe thead th {
        text-align: right;
    }
</style>
<table border="1" class="dataframe">
  <thead>
    <tr style="text-align: right;">
      <th></th>
      <th>title</th>
      <th>year_or_season</th>
      <th>movie_rating</th>
      <th>disc_or_duration</th>
      <th>user_rating</th>
      <th>avg_rating</th>
      <th>ship_date</th>
      <th>return_date</th>
    </tr>
  </thead>
  <tbody>
    <tr>
      <th>dad_461</th>
      <td>1 Giant Leap</td>
      <td>2002</td>
      <td>NR</td>
      <td>2h 35m</td>
      <td>2.0</td>
      <td>3.1</td>
      <td>2007-10-19</td>
      <td>2007-10-30</td>
    </tr>
    <tr>
      <th>mom_1296</th>
      <td>1 Giant Leap</td>
      <td>2002</td>
      <td>NR</td>
      <td>2h 35m</td>
      <td>0.0</td>
      <td>3.7</td>
      <td>2007-10-19</td>
      <td>2007-10-30</td>
    </tr>
    <tr>
      <th>dad_463</th>
      <td>10 mph</td>
      <td>2007</td>
      <td>NR</td>
      <td>1h 32m</td>
      <td>3.0</td>
      <td>3.5</td>
      <td>2007-10-02</td>
      <td>2007-10-10</td>
    </tr>
    <tr>
      <th>mom_1300</th>
      <td>10 mph</td>
      <td>2007</td>
      <td>NR</td>
      <td>1h 32m</td>
      <td>0.0</td>
      <td>2.8</td>
      <td>2007-10-02</td>
      <td>2007-10-10</td>
    </tr>
    <tr>
      <th>dad_361</th>
      <td>127 Hours</td>
      <td>2010</td>
      <td>R</td>
      <td>1h 34m</td>
      <td>3.0</td>
      <td>4.2</td>
      <td>2011-07-06</td>
      <td>2011-07-19</td>
    </tr>
    <tr>
      <th>mom_974</th>
      <td>127 Hours</td>
      <td>2010</td>
      <td>R</td>
      <td>1h 34m</td>
      <td>0.0</td>
      <td>3.8</td>
      <td>2011-07-06</td>
      <td>2011-07-19</td>
    </tr>
    <tr>
      <th>dad_68</th>
      <td>1917</td>
      <td>2019</td>
      <td>R</td>
      <td>1h 59m</td>
      <td>0.0</td>
      <td>4.7</td>
      <td>2020-09-22</td>
      <td>2020-10-07</td>
    </tr>
    <tr>
      <th>mom_179</th>
      <td>1917</td>
      <td>2019</td>
      <td>R</td>
      <td>1h 59m</td>
      <td>0.0</td>
      <td>4.3</td>
      <td>2020-09-22</td>
      <td>2020-10-07</td>
    </tr>
    <tr>
      <th>dad_221</th>
      <td>45 Years</td>
      <td>2015</td>
      <td>R</td>
      <td>1h 35m</td>
      <td>5.0</td>
      <td>3.8</td>
      <td>2016-07-18</td>
      <td>2016-08-02</td>
    </tr>
    <tr>
      <th>mom_571</th>
      <td>45 Years</td>
      <td>2015</td>
      <td>R</td>
      <td>1h 35m</td>
      <td>0.0</td>
      <td>3.4</td>
      <td>2016-07-18</td>
      <td>2016-08-02</td>
    </tr>
    <tr>
      <th>mom_148</th>
      <td>A Bad Moms Christmas</td>
      <td>2017</td>
      <td>R</td>
      <td>1h 44m</td>
      <td>0.0</td>
      <td>2.9</td>
      <td>2021-02-09</td>
      <td>2021-02-16</td>
    </tr>
    <tr>
      <th>dad_56</th>
      <td>A Bad Moms Christmas</td>
      <td>2017</td>
      <td>R</td>
      <td>1h 44m</td>
      <td>0.0</td>
      <td>3.7</td>
      <td>2021-02-09</td>
      <td>2021-02-16</td>
    </tr>
    <tr>
      <th>mom_888</th>
      <td>A Better Life</td>
      <td>2011</td>
      <td>PG-13</td>
      <td>1h 37m</td>
      <td>0.0</td>
      <td>3.8</td>
      <td>2012-07-17</td>
      <td>2012-07-31</td>
    </tr>
    <tr>
      <th>dad_325</th>
      <td>A Better Life</td>
      <td>2011</td>
      <td>PG-13</td>
      <td>1h 37m</td>
      <td>4.0</td>
      <td>4.4</td>
      <td>2012-07-17</td>
      <td>2012-07-31</td>
    </tr>
    <tr>
      <th>dad_422</th>
      <td>A Collection of 2007 Academy Award Nominated S...</td>
      <td>2007</td>
      <td>NR</td>
      <td>3h 15m</td>
      <td>0.0</td>
      <td>3.9</td>
      <td>2009-09-01</td>
      <td>2009-09-18</td>
    </tr>
    <tr>
      <th>mom_1133</th>
      <td>A Collection of 2007 Academy Award Nominated S...</td>
      <td>2007</td>
      <td>NR</td>
      <td>3h 15m</td>
      <td>0.0</td>
      <td>3.5</td>
      <td>2009-09-01</td>
      <td>2009-09-18</td>
    </tr>
    <tr>
      <th>mom_293</th>
      <td>A French Village: The Complete Collection</td>
      <td>Collection All</td>
      <td>NR</td>
      <td>Disc 9</td>
      <td>0.0</td>
      <td>4.6</td>
      <td>2019-08-29</td>
      <td>2019-09-09</td>
    </tr>
    <tr>
      <th>mom_292</th>
      <td>A French Village: The Complete Collection</td>
      <td>Collection All</td>
      <td>NR</td>
      <td>Disc 10</td>
      <td>0.0</td>
      <td>4.6</td>
      <td>2019-09-04</td>
      <td>2019-09-10</td>
    </tr>
    <tr>
      <th>mom_296</th>
      <td>A French Village: The Complete Collection</td>
      <td>Collection All</td>
      <td>NR</td>
      <td>Disc 7</td>
      <td>0.0</td>
      <td>4.6</td>
      <td>2019-08-19</td>
      <td>2019-08-29</td>
    </tr>
    <tr>
      <th>mom_291</th>
      <td>A French Village: The Complete Collection</td>
      <td>Collection All</td>
      <td>NR</td>
      <td>Disc 12</td>
      <td>0.0</td>
      <td>4.6</td>
      <td>2019-09-10</td>
      <td>2019-09-17</td>
    </tr>
  </tbody>
</table>
</div>

<p>Answer: definitely not.</p>

<p>Looks ike there are two ways for a movie to be duplicated: (1) it’s part of a TV series collection, or (2) it shows up on both mom and dad’s histories. For #2, I initially thought it would only be when they both rated the movie differently, but you can see above that there’s one example (“A Bad Moms Christmas”) where neither of them rated it, but for some reason they have difffferent average ratings. It’s very possible that my assumption of what the “data-rating” field means is wrong (maybe it’s the average rating for the type of user they’ve categorized each acount in?), or perhaps there’s something about when the data was last updated (though that would be strange because I downloaded both of these histories on the same day).</p>

<p>Anyway, let’s keep going and worry about figuring out the ratings later, if at all. For now, it looks like what I care about as a unique rental is a unique combination of title and “duration” column. Did we ever rent the same movie twice?</p>

<div class="language-python highlighter-rouge"><div class="highlight"><pre class="highlight"><code><span class="n">df</span><span class="p">.</span><span class="n">groupby</span><span class="p">([</span><span class="s">'title'</span><span class="p">,</span> <span class="s">'disc_or_duration'</span><span class="p">]).</span><span class="nb">filter</span><span class="p">(</span>
    <span class="k">lambda</span> <span class="n">x</span><span class="p">:</span> <span class="nb">len</span><span class="p">(</span><span class="n">x</span><span class="p">[</span><span class="s">'ship_date'</span><span class="p">].</span><span class="n">unique</span><span class="p">())</span> <span class="o">&gt;</span> <span class="mi">1</span>
<span class="p">).</span><span class="n">sort_values</span><span class="p">(</span><span class="n">by</span><span class="o">=</span><span class="p">[</span><span class="s">'title'</span><span class="p">,</span> <span class="s">'disc_or_duration'</span><span class="p">]).</span><span class="n">head</span><span class="p">(</span><span class="mi">20</span><span class="p">)</span>

</code></pre></div></div>

<div>
<style scoped="">
    .dataframe tbody tr th:only-of-type {
        vertical-align: middle;
    }

    .dataframe tbody tr th {
        vertical-align: top;
    }

    .dataframe thead th {
        text-align: right;
    }
</style>
<table border="1" class="dataframe">
  <thead>
    <tr style="text-align: right;">
      <th></th>
      <th>title</th>
      <th>year_or_season</th>
      <th>movie_rating</th>
      <th>disc_or_duration</th>
      <th>user_rating</th>
      <th>avg_rating</th>
      <th>ship_date</th>
      <th>return_date</th>
    </tr>
  </thead>
  <tbody>
    <tr>
      <th>mom_667</th>
      <td>A Most Wanted Man</td>
      <td>2014</td>
      <td>R</td>
      <td>2h 1m</td>
      <td>0.0</td>
      <td>3.9</td>
      <td>2015-05-05</td>
      <td>2015-05-12</td>
    </tr>
    <tr>
      <th>mom_693</th>
      <td>A Most Wanted Man</td>
      <td>2014</td>
      <td>R</td>
      <td>2h 1m</td>
      <td>0.0</td>
      <td>3.9</td>
      <td>2015-01-21</td>
      <td>2015-02-02</td>
    </tr>
    <tr>
      <th>dad_262</th>
      <td>A Most Wanted Man</td>
      <td>2014</td>
      <td>R</td>
      <td>2h 1m</td>
      <td>4.0</td>
      <td>4.2</td>
      <td>2015-01-21</td>
      <td>2015-02-02</td>
    </tr>
    <tr>
      <th>mom_797</th>
      <td>Anchorman: The Legend of Ron Burgundy</td>
      <td>2004</td>
      <td>UR</td>
      <td>1h 34m</td>
      <td>2.0</td>
      <td>2.4</td>
      <td>2013-08-20</td>
      <td>2013-08-24</td>
    </tr>
    <tr>
      <th>mom_1382</th>
      <td>Anchorman: The Legend of Ron Burgundy</td>
      <td>2004</td>
      <td>UR</td>
      <td>1h 34m</td>
      <td>2.0</td>
      <td>2.4</td>
      <td>2006-11-27</td>
      <td>2006-12-05</td>
    </tr>
    <tr>
      <th>dad_297</th>
      <td>Anchorman: The Legend of Ron Burgundy</td>
      <td>2004</td>
      <td>UR</td>
      <td>1h 34m</td>
      <td>2.0</td>
      <td>2.9</td>
      <td>2013-08-20</td>
      <td>2013-08-24</td>
    </tr>
    <tr>
      <th>dad_491</th>
      <td>Anchorman: The Legend of Ron Burgundy</td>
      <td>2004</td>
      <td>UR</td>
      <td>1h 34m</td>
      <td>2.0</td>
      <td>2.9</td>
      <td>2006-11-27</td>
      <td>2006-12-05</td>
    </tr>
    <tr>
      <th>mom_175</th>
      <td>Awakenings</td>
      <td>1990</td>
      <td>PG-13</td>
      <td>2h 0m</td>
      <td>0.0</td>
      <td>4.1</td>
      <td>2020-10-06</td>
      <td>2020-10-15</td>
    </tr>
    <tr>
      <th>mom_642</th>
      <td>Awakenings</td>
      <td>1990</td>
      <td>PG-13</td>
      <td>2h 0m</td>
      <td>0.0</td>
      <td>4.1</td>
      <td>2015-08-24</td>
      <td>2015-09-02</td>
    </tr>
    <tr>
      <th>mom_795</th>
      <td>Bad Education</td>
      <td>2004</td>
      <td>NC-17</td>
      <td>1h 46m</td>
      <td>4.0</td>
      <td>4.1</td>
      <td>2013-08-24</td>
      <td>2013-08-31</td>
    </tr>
    <tr>
      <th>mom_1229</th>
      <td>Bad Education</td>
      <td>2004</td>
      <td>NC-17</td>
      <td>1h 46m</td>
      <td>4.0</td>
      <td>4.1</td>
      <td>2008-06-20</td>
      <td>2008-07-15</td>
    </tr>
    <tr>
      <th>dad_296</th>
      <td>Bad Education</td>
      <td>2004</td>
      <td>NC-17</td>
      <td>1h 46m</td>
      <td>0.0</td>
      <td>4.1</td>
      <td>2013-08-24</td>
      <td>2013-08-31</td>
    </tr>
    <tr>
      <th>mom_312</th>
      <td>Before Sunset</td>
      <td>2004</td>
      <td>R</td>
      <td>1h 20m</td>
      <td>2.0</td>
      <td>3.8</td>
      <td>2019-04-24</td>
      <td>2019-05-13</td>
    </tr>
    <tr>
      <th>mom_1371</th>
      <td>Before Sunset</td>
      <td>2004</td>
      <td>R</td>
      <td>1h 20m</td>
      <td>2.0</td>
      <td>3.8</td>
      <td>2007-01-08</td>
      <td>2007-01-22</td>
    </tr>
    <tr>
      <th>mom_1476</th>
      <td>Before Sunset</td>
      <td>2004</td>
      <td>R</td>
      <td>1h 20m</td>
      <td>2.0</td>
      <td>3.8</td>
      <td>2005-10-25</td>
      <td>2005-11-09</td>
    </tr>
    <tr>
      <th>dad_126</th>
      <td>Before Sunset</td>
      <td>2004</td>
      <td>R</td>
      <td>1h 20m</td>
      <td>4.0</td>
      <td>3.4</td>
      <td>2019-04-24</td>
      <td>2019-05-13</td>
    </tr>
    <tr>
      <th>mom_258</th>
      <td>Big Little Lies</td>
      <td>Season 2</td>
      <td>TV-MA</td>
      <td>Disc 1</td>
      <td>0.0</td>
      <td>4.4</td>
      <td>2020-01-24</td>
      <td>2020-02-11</td>
    </tr>
    <tr>
      <th>mom_429</th>
      <td>Big Little Lies</td>
      <td>Season 1</td>
      <td>TV-MA</td>
      <td>Disc 1</td>
      <td>0.0</td>
      <td>4.4</td>
      <td>2018-01-23</td>
      <td>2018-02-05</td>
    </tr>
    <tr>
      <th>dad_109</th>
      <td>Big Little Lies</td>
      <td>Season 2</td>
      <td>TV-MA</td>
      <td>Disc 1</td>
      <td>5.0</td>
      <td>5.0</td>
      <td>2020-01-24</td>
      <td>2020-02-11</td>
    </tr>
    <tr>
      <th>dad_167</th>
      <td>Big Little Lies</td>
      <td>Season 1</td>
      <td>TV-MA</td>
      <td>Disc 1</td>
      <td>5.0</td>
      <td>5.0</td>
      <td>2018-01-23</td>
      <td>2018-02-05</td>
    </tr>
  </tbody>
</table>
</div>

<p>Ok, so yes there are definitely movies that were rented multiple times! Interestingly, some of these are duplicated between both mom and dad’s accounts but some aren’t. I’m assuming this has to do with how Netflix handled the transition between not having accounts, having distinct accounts in the same family plan, and perhaps also how the DVD’s were shared across accounts vs. assigned to individual accounts.</p>

<p>I don’t really care about those intricacies, since I’m just taking this data as the holistic family plan. Let’s get rid of these fake duplicates, and consider coming back later to do some “mom vs. dad” analyses.</p>

<p>Actually, before we move on let’s check that the two lists are actually unique…</p>

<div class="language-python highlighter-rouge"><div class="highlight"><pre class="highlight"><code><span class="p">[</span><span class="n">k</span> <span class="k">for</span> <span class="n">k</span> <span class="ow">in</span> <span class="n">dad_dict</span> <span class="k">if</span> <span class="n">k</span> <span class="ow">not</span> <span class="ow">in</span> <span class="n">mom_dict</span><span class="p">]</span>
</code></pre></div></div>

<div class="language-plaintext highlighter-rouge"><div class="highlight"><pre class="highlight"><code>[]
</code></pre></div></div>

<p>D’oh! The history I downloaded from my dad’s account is a subset of the history in my mom’s. So I could have simplified this whole thing by just looking at her history export, though I suppose that would have removed any of the mom vs. dad rating discrepancies. Anyway, I don’t care about those so let’s get on with the plan.</p>

<div class="language-python highlighter-rouge"><div class="highlight"><pre class="highlight"><code><span class="k">print</span><span class="p">(</span><span class="sa">f</span><span class="s">'With duplicates: </span><span class="si">{</span><span class="n">df</span><span class="p">.</span><span class="n">shape</span><span class="si">}</span><span class="s">, without: </span><span class="si">{</span><span class="n">df</span><span class="p">.</span><span class="n">drop_duplicates</span><span class="p">().</span><span class="n">shape</span><span class="si">}</span><span class="s">'</span><span class="p">)</span>
<span class="n">df</span> <span class="o">=</span> <span class="n">df</span><span class="p">.</span><span class="n">drop_duplicates</span><span class="p">()</span>
</code></pre></div></div>

<div class="language-plaintext highlighter-rouge"><div class="highlight"><pre class="highlight"><code>With duplicates: (2106, 8), without: (2090, 8)
</code></pre></div></div>

<div class="language-python highlighter-rouge"><div class="highlight"><pre class="highlight"><code><span class="c1"># Ok now how many movies did we rent twice?
</span><span class="k">print</span><span class="p">(</span><span class="sa">f</span><span class="s">"Total rentals = </span><span class="si">{</span><span class="n">df</span><span class="p">[[</span><span class="s">'title'</span><span class="p">,</span> <span class="s">'year_or_season'</span><span class="p">,</span> <span class="s">'disc_or_duration'</span><span class="p">,</span> <span class="s">'ship_date'</span><span class="p">]].</span><span class="n">drop_duplicates</span><span class="p">().</span><span class="n">shape</span><span class="p">[</span><span class="mi">0</span><span class="p">]</span><span class="si">}</span><span class="s">"</span><span class="p">)</span>

<span class="c1"># There must be a way to use transform instead of all these reset_index...
</span><span class="p">(</span><span class="n">df</span><span class="p">[[</span><span class="s">'title'</span><span class="p">,</span> <span class="s">'year_or_season'</span><span class="p">,</span> <span class="s">'disc_or_duration'</span><span class="p">,</span> <span class="s">'ship_date'</span><span class="p">]]</span>
 <span class="p">.</span><span class="n">drop_duplicates</span><span class="p">()</span>
 <span class="p">.</span><span class="n">groupby</span><span class="p">([</span><span class="s">'title'</span><span class="p">,</span> <span class="s">'year_or_season'</span><span class="p">,</span> <span class="s">'disc_or_duration'</span><span class="p">])</span>
 <span class="p">.</span><span class="n">size</span><span class="p">()</span>
 <span class="p">.</span><span class="n">reset_index</span><span class="p">(</span><span class="n">name</span><span class="o">=</span><span class="s">'n_rentals'</span><span class="p">)</span>
 <span class="p">[</span><span class="s">'n_rentals'</span><span class="p">].</span><span class="n">value_counts</span><span class="p">()</span>
<span class="p">).</span><span class="n">reset_index</span><span class="p">().</span><span class="n">sort_values</span><span class="p">(</span><span class="s">'n_rentals'</span><span class="p">)</span>
</code></pre></div></div>

<div class="language-plaintext highlighter-rouge"><div class="highlight"><pre class="highlight"><code>Total rentals = 1596
</code></pre></div></div>

<div>
<style scoped="">
    .dataframe tbody tr th:only-of-type {
        vertical-align: middle;
    }

    .dataframe tbody tr th {
        vertical-align: top;
    }

    .dataframe thead th {
        text-align: right;
    }
</style>
<table border="1" class="dataframe">
  <thead>
    <tr style="text-align: right;">
      <th></th>
      <th>n_rentals</th>
      <th>count</th>
    </tr>
  </thead>
  <tbody>
    <tr>
      <th>0</th>
      <td>1</td>
      <td>1441</td>
    </tr>
    <tr>
      <th>1</th>
      <td>2</td>
      <td>76</td>
    </tr>
    <tr>
      <th>2</th>
      <td>3</td>
      <td>1</td>
    </tr>
  </tbody>
</table>
</div>

<p>In total, my parents made a total of 1596 unique rentals. Of these, 1441 were for movies they rented only once. They rented 76 movies twice, and one movie three times. Let’s see what the lucky movie was!</p>

<div class="language-python highlighter-rouge"><div class="highlight"><pre class="highlight"><code><span class="p">(</span><span class="n">df</span><span class="p">[[</span><span class="s">'title'</span><span class="p">,</span> <span class="s">'year_or_season'</span><span class="p">,</span> <span class="s">'disc_or_duration'</span><span class="p">,</span> <span class="s">'ship_date'</span><span class="p">]]</span>
 <span class="p">.</span><span class="n">drop_duplicates</span><span class="p">()</span>
 <span class="p">.</span><span class="n">groupby</span><span class="p">([</span><span class="s">'title'</span><span class="p">,</span> <span class="s">'year_or_season'</span><span class="p">,</span> <span class="s">'disc_or_duration'</span><span class="p">])</span>
 <span class="p">.</span><span class="nb">filter</span><span class="p">(</span><span class="k">lambda</span> <span class="n">x</span><span class="p">:</span> <span class="nb">len</span><span class="p">(</span><span class="n">x</span><span class="p">[</span><span class="s">'title'</span><span class="p">])</span> <span class="o">&gt;=</span> <span class="mi">3</span><span class="p">)</span>
<span class="p">)</span>
</code></pre></div></div>

<div>
<style scoped="">
    .dataframe tbody tr th:only-of-type {
        vertical-align: middle;
    }

    .dataframe tbody tr th {
        vertical-align: top;
    }

    .dataframe thead th {
        text-align: right;
    }
</style>
<table border="1" class="dataframe">
  <thead>
    <tr style="text-align: right;">
      <th></th>
      <th>title</th>
      <th>year_or_season</th>
      <th>disc_or_duration</th>
      <th>ship_date</th>
    </tr>
  </thead>
  <tbody>
    <tr>
      <th>mom_312</th>
      <td>Before Sunset</td>
      <td>2004</td>
      <td>1h 20m</td>
      <td>2019-04-24</td>
    </tr>
    <tr>
      <th>mom_1371</th>
      <td>Before Sunset</td>
      <td>2004</td>
      <td>1h 20m</td>
      <td>2007-01-08</td>
    </tr>
    <tr>
      <th>mom_1476</th>
      <td>Before Sunset</td>
      <td>2004</td>
      <td>1h 20m</td>
      <td>2005-10-25</td>
    </tr>
  </tbody>
</table>
</div>

<p>Looks like it’s Before Sunset, which makes sense - it came out in 2004, and was probably a movie that my parents and I both rented separately while I was in high school, and then that I guess my parents re-watched in 2019.</p>

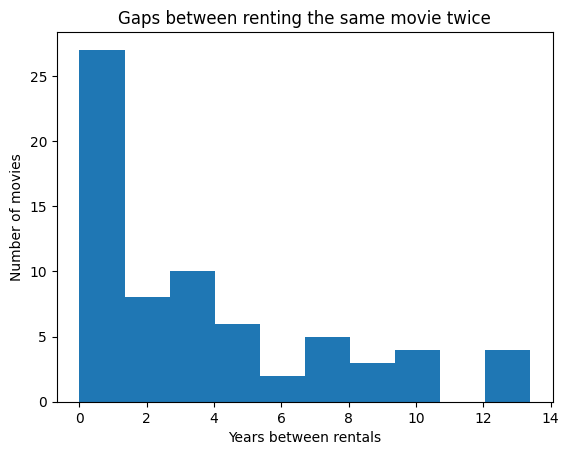
<p>Let’s see how big of a gap there was between the two rentals for the movies we rented twice.</p>

<div class="language-python highlighter-rouge"><div class="highlight"><pre class="highlight"><code><span class="n">double_rentals</span> <span class="o">=</span> <span class="p">(</span><span class="n">df</span><span class="p">[[</span><span class="s">'title'</span><span class="p">,</span> <span class="s">'year_or_season'</span><span class="p">,</span> <span class="s">'disc_or_duration'</span><span class="p">,</span> <span class="s">'ship_date'</span><span class="p">]]</span>
 <span class="p">.</span><span class="n">drop_duplicates</span><span class="p">()</span>
 <span class="p">.</span><span class="n">groupby</span><span class="p">([</span><span class="s">'title'</span><span class="p">,</span> <span class="s">'year_or_season'</span><span class="p">,</span> <span class="s">'disc_or_duration'</span><span class="p">])</span>
 <span class="p">.</span><span class="nb">filter</span><span class="p">(</span><span class="k">lambda</span> <span class="n">x</span><span class="p">:</span> <span class="nb">len</span><span class="p">(</span><span class="n">x</span><span class="p">[</span><span class="s">'title'</span><span class="p">])</span> <span class="o">==</span> <span class="mi">2</span><span class="p">)</span>
<span class="p">)</span>

<span class="n">delta_rental</span> <span class="o">=</span> <span class="p">(</span>
    <span class="n">double_rentals</span><span class="p">.</span><span class="n">groupby</span><span class="p">(</span><span class="s">'title'</span><span class="p">).</span><span class="nb">apply</span><span class="p">(</span>
        <span class="k">lambda</span> <span class="n">x</span><span class="p">:</span> <span class="n">x</span><span class="p">[</span><span class="s">'ship_date'</span><span class="p">].</span><span class="nb">max</span><span class="p">()</span> <span class="o">-</span> <span class="n">x</span><span class="p">[</span><span class="s">'ship_date'</span><span class="p">].</span><span class="nb">min</span><span class="p">()</span>
    <span class="p">).</span><span class="n">reset_index</span><span class="p">(</span><span class="n">name</span><span class="o">=</span><span class="s">'time_between_rentals'</span><span class="p">)</span>
<span class="p">)</span>

<span class="n">delta_rental</span><span class="p">[</span><span class="s">'days_between_rentals'</span><span class="p">]</span> <span class="o">=</span> <span class="n">delta_rental</span><span class="p">[</span><span class="s">'time_between_rentals'</span><span class="p">].</span><span class="nb">apply</span><span class="p">(</span><span class="k">lambda</span> <span class="n">x</span><span class="p">:</span> <span class="n">x</span><span class="p">.</span><span class="n">days</span><span class="p">)</span>
<span class="n">delta_rental</span><span class="p">[</span><span class="s">'years_between_rentals'</span><span class="p">]</span> <span class="o">=</span> <span class="n">delta_rental</span><span class="p">[</span><span class="s">'days_between_rentals'</span><span class="p">]</span> <span class="o">/</span> <span class="mf">365.</span>

<span class="n">ax</span> <span class="o">=</span> <span class="n">delta_rental</span><span class="p">[</span><span class="s">'years_between_rentals'</span><span class="p">].</span><span class="n">plot</span><span class="p">(</span><span class="n">kind</span><span class="o">=</span><span class="s">'hist'</span><span class="p">)</span>
<span class="n">ax</span><span class="p">.</span><span class="n">set_title</span><span class="p">(</span><span class="s">'Gaps between renting the same movie twice'</span><span class="p">)</span>
<span class="n">ax</span><span class="p">.</span><span class="n">set_xlabel</span><span class="p">(</span><span class="s">'Years between rentals'</span><span class="p">)</span>
<span class="n">ax</span><span class="p">.</span><span class="n">set_ylabel</span><span class="p">(</span><span class="s">'Number of movies'</span><span class="p">)</span>
</code></pre></div></div>

<div class="language-plaintext highlighter-rouge"><div class="highlight"><pre class="highlight"><code>Text(0, 0.5, 'Number of movies')
</code></pre></div></div>

<p><img src="/images/2023-04-20-netflix-dvd-history_files/2023-04-20-netflix-dvd-history_20_1.png" alt="png" /></p>

<div class="language-python highlighter-rouge"><div class="highlight"><pre class="highlight"><code><span class="n">delta_rental</span><span class="p">.</span><span class="n">sort_values</span><span class="p">(</span><span class="n">by</span><span class="o">=</span><span class="s">'years_between_rentals'</span><span class="p">,</span> <span class="n">ascending</span><span class="o">=</span><span class="bp">False</span><span class="p">)[[</span><span class="s">'title'</span><span class="p">,</span> <span class="s">'time_between_rentals'</span><span class="p">,</span> <span class="s">'years_between_rentals'</span><span class="p">]]</span>
</code></pre></div></div>

<div>
<style scoped="">
    .dataframe tbody tr th:only-of-type {
        vertical-align: middle;
    }

    .dataframe tbody tr th {
        vertical-align: top;
    }

    .dataframe thead th {
        text-align: right;
    }
</style>
<table border="1" class="dataframe">
  <thead>
    <tr style="text-align: right;">
      <th></th>
      <th>title</th>
      <th>time_between_rentals</th>
      <th>years_between_rentals</th>
    </tr>
  </thead>
  <tbody>
    <tr>
      <th>66</th>
      <td>Wasabi</td>
      <td>4891 days</td>
      <td>13.400000</td>
    </tr>
    <tr>
      <th>23</th>
      <td>Heat</td>
      <td>4850 days</td>
      <td>13.287671</td>
    </tr>
    <tr>
      <th>65</th>
      <td>War Dance</td>
      <td>4672 days</td>
      <td>12.800000</td>
    </tr>
    <tr>
      <th>50</th>
      <td>The Lady Vanishes</td>
      <td>4613 days</td>
      <td>12.638356</td>
    </tr>
    <tr>
      <th>38</th>
      <td>Raise the Red Lantern</td>
      <td>3828 days</td>
      <td>10.487671</td>
    </tr>
    <tr>
      <th>...</th>
      <td>...</td>
      <td>...</td>
      <td>...</td>
    </tr>
    <tr>
      <th>55</th>
      <td>The Miseducation of Cameron Post</td>
      <td>15 days</td>
      <td>0.041096</td>
    </tr>
    <tr>
      <th>24</th>
      <td>Homeland</td>
      <td>14 days</td>
      <td>0.038356</td>
    </tr>
    <tr>
      <th>34</th>
      <td>Once Upon a Time in Hollywood</td>
      <td>4 days</td>
      <td>0.010959</td>
    </tr>
    <tr>
      <th>45</th>
      <td>The Curious Case of Benjamin Button</td>
      <td>1 days</td>
      <td>0.002740</td>
    </tr>
    <tr>
      <th>60</th>
      <td>The Soloist</td>
      <td>1 days</td>
      <td>0.002740</td>
    </tr>
  </tbody>
</table>
<p>69 rows × 3 columns</p>
</div>

<div class="language-python highlighter-rouge"><div class="highlight"><pre class="highlight"><code><span class="n">df</span><span class="p">.</span><span class="n">query</span><span class="p">(</span><span class="s">'title == "The Curious Case of Benjamin Button"'</span><span class="p">)</span>
</code></pre></div></div>

<div>
<style scoped="">
    .dataframe tbody tr th:only-of-type {
        vertical-align: middle;
    }

    .dataframe tbody tr th {
        vertical-align: top;
    }

    .dataframe thead th {
        text-align: right;
    }
</style>
<table border="1" class="dataframe">
  <thead>
    <tr style="text-align: right;">
      <th></th>
      <th>title</th>
      <th>year_or_season</th>
      <th>movie_rating</th>
      <th>disc_or_duration</th>
      <th>user_rating</th>
      <th>avg_rating</th>
      <th>ship_date</th>
      <th>return_date</th>
    </tr>
  </thead>
  <tbody>
    <tr>
      <th>mom_1155</th>
      <td>The Curious Case of Benjamin Button</td>
      <td>2008</td>
      <td>PG-13</td>
      <td>2h 46m</td>
      <td>4.0</td>
      <td>4.0</td>
      <td>2009-06-16</td>
      <td>2009-06-23</td>
    </tr>
    <tr>
      <th>mom_1156</th>
      <td>The Curious Case of Benjamin Button</td>
      <td>2008</td>
      <td>PG-13</td>
      <td>2h 46m</td>
      <td>4.0</td>
      <td>4.0</td>
      <td>2009-06-15</td>
      <td>2009-06-19</td>
    </tr>
    <tr>
      <th>dad_428</th>
      <td>The Curious Case of Benjamin Button</td>
      <td>2008</td>
      <td>PG-13</td>
      <td>2h 46m</td>
      <td>5.0</td>
      <td>4.1</td>
      <td>2009-06-16</td>
      <td>2009-06-23</td>
    </tr>
  </tbody>
</table>
</div>

<p>There are a handful of movies that we rented twice ten years apart, and some that we rented one day apart! The ones that we rented one day apart might be a fluke, or perhaps they were movies that we had on the waitlist with both of our accounts and didn’t coordinate to not duplicate them. That makes sense.</p>

<p>Anyway, now that I understand the data much better, let’s dig in some more to all the non-rating-related information.</p>

<div class="language-python highlighter-rouge"><div class="highlight"><pre class="highlight"><code><span class="n">df</span> <span class="o">=</span> <span class="n">df</span><span class="p">[[</span><span class="s">'title'</span><span class="p">,</span> <span class="s">'year_or_season'</span><span class="p">,</span> <span class="s">'disc_or_duration'</span><span class="p">,</span> <span class="s">'ship_date'</span><span class="p">,</span> <span class="s">'return_date'</span><span class="p">]].</span><span class="n">drop_duplicates</span><span class="p">()</span>
</code></pre></div></div>

<div class="language-python highlighter-rouge"><div class="highlight"><pre class="highlight"><code><span class="c1"># first and last movie rental?
# how many movies per month?
# average duration of keeping movies
</span>
<span class="p">(</span><span class="n">df</span><span class="p">[</span><span class="s">'return_date'</span><span class="p">].</span><span class="nb">max</span><span class="p">()</span> <span class="o">-</span> <span class="n">df</span><span class="p">[</span><span class="s">'ship_date'</span><span class="p">].</span><span class="nb">min</span><span class="p">()).</span><span class="n">days</span> <span class="o">/</span> <span class="mf">365.</span>
</code></pre></div></div>

<div class="language-plaintext highlighter-rouge"><div class="highlight"><pre class="highlight"><code>18.284931506849315
</code></pre></div></div>

<p>Wow, we were signed up for Netflix’s DVD service for over 18 years! That’s pretty amazing, and probably outlasts every commitment my parents made apart from maybe their longest jobs and homes and, oh right, their kids.</p>

<p>1596 rentals over 18 years is a little over 88 movies per year, which is about 1.5 movies per week for 18 years. Considering that we were subscribed to a plan with 3 DVD’s for the majority of that time, that’s a pretty impressive utilization rate.</p>

<p>Let’s see if we can visualize this data nicely. I’ll use the return date as a proxy for when the movie was watched, since we were usually pretty prompt about returning the movies after watching them.</p>

<p><em>Side note for the folks interested in data wrangling: I realized that I have 1596 unique rentals when considering the ship date, but 1598 unique rows in the data when including the return date for this analysis. It looks like there are two movies with the same ship date but different return dates; I’m assuming that’s a bug in Netflix’s data, unless my parents and I both rented the same DVD on the exact same day and returned them both exactly three days apart. Given that I’ve still never seen The Big Sick and don’t know what The Harvey Girls is, I’m betting on dirty data.</em></p>

<div class="language-python highlighter-rouge"><div class="highlight"><pre class="highlight"><code><span class="n">df</span><span class="p">.</span><span class="n">groupby</span><span class="p">(</span>
    <span class="p">[</span><span class="s">'title'</span><span class="p">,</span> <span class="s">'year_or_season'</span><span class="p">,</span> <span class="s">'disc_or_duration'</span><span class="p">,</span> <span class="s">'ship_date'</span><span class="p">]</span>
<span class="p">).</span><span class="n">size</span><span class="p">().</span><span class="n">reset_index</span><span class="p">(</span><span class="n">name</span><span class="o">=</span><span class="s">'size'</span><span class="p">).</span><span class="n">sort_values</span><span class="p">(</span><span class="n">by</span><span class="o">=</span><span class="s">'size'</span><span class="p">)</span>
</code></pre></div></div>

<div>
<style scoped="">
    .dataframe tbody tr th:only-of-type {
        vertical-align: middle;
    }

    .dataframe tbody tr th {
        vertical-align: top;
    }

    .dataframe thead th {
        text-align: right;
    }
</style>
<table border="1" class="dataframe">
  <thead>
    <tr style="text-align: right;">
      <th></th>
      <th>title</th>
      <th>year_or_season</th>
      <th>disc_or_duration</th>
      <th>ship_date</th>
      <th>size</th>
    </tr>
  </thead>
  <tbody>
    <tr>
      <th>0</th>
      <td>1 Giant Leap</td>
      <td>2002</td>
      <td>2h 35m</td>
      <td>2007-10-19</td>
      <td>1</td>
    </tr>
    <tr>
      <th>1067</th>
      <td>Summer Hours</td>
      <td>2008</td>
      <td>1h 43m</td>
      <td>2015-09-02</td>
      <td>1</td>
    </tr>
    <tr>
      <th>1066</th>
      <td>Suits</td>
      <td>Season 1</td>
      <td>Disc 1</td>
      <td>2012-05-22</td>
      <td>1</td>
    </tr>
    <tr>
      <th>1065</th>
      <td>Suffragette</td>
      <td>2015</td>
      <td>1h 46m</td>
      <td>2016-12-06</td>
      <td>1</td>
    </tr>
    <tr>
      <th>1064</th>
      <td>Stranger than Paradise</td>
      <td>1984</td>
      <td>1h 29m</td>
      <td>2010-09-27</td>
      <td>1</td>
    </tr>
    <tr>
      <th>...</th>
      <td>...</td>
      <td>...</td>
      <td>...</td>
      <td>...</td>
      <td>...</td>
    </tr>
    <tr>
      <th>525</th>
      <td>God Grew Tired of Us</td>
      <td>2006</td>
      <td>1h 29m</td>
      <td>2011-08-23</td>
      <td>1</td>
    </tr>
    <tr>
      <th>534</th>
      <td>GoodFellas</td>
      <td>1990</td>
      <td>2h 25m</td>
      <td>2007-03-12</td>
      <td>1</td>
    </tr>
    <tr>
      <th>1595</th>
      <td>Zero Dark Thirty</td>
      <td>2012</td>
      <td>2h 37m</td>
      <td>2013-04-26</td>
      <td>1</td>
    </tr>
    <tr>
      <th>1140</th>
      <td>The Big Sick</td>
      <td>2017</td>
      <td>1h 59m</td>
      <td>2017-10-24</td>
      <td>2</td>
    </tr>
    <tr>
      <th>1244</th>
      <td>The Harvey Girls</td>
      <td>1946</td>
      <td>1h 41m</td>
      <td>2021-12-13</td>
      <td>2</td>
    </tr>
  </tbody>
</table>
<p>1596 rows × 5 columns</p>
</div>

<div class="language-python highlighter-rouge"><div class="highlight"><pre class="highlight"><code><span class="n">df</span><span class="p">.</span><span class="n">query</span><span class="p">(</span><span class="s">'title == "The Big Sick"'</span><span class="p">)</span>
</code></pre></div></div>

<div>
<style scoped="">
    .dataframe tbody tr th:only-of-type {
        vertical-align: middle;
    }

    .dataframe tbody tr th {
        vertical-align: top;
    }

    .dataframe thead th {
        text-align: right;
    }
</style>
<table border="1" class="dataframe">
  <thead>
    <tr style="text-align: right;">
      <th></th>
      <th>title</th>
      <th>year_or_season</th>
      <th>disc_or_duration</th>
      <th>ship_date</th>
      <th>return_date</th>
    </tr>
  </thead>
  <tbody>
    <tr>
      <th>mom_445</th>
      <td>The Big Sick</td>
      <td>2017</td>
      <td>1h 59m</td>
      <td>2017-10-24</td>
      <td>2017-10-30</td>
    </tr>
    <tr>
      <th>mom_446</th>
      <td>The Big Sick</td>
      <td>2017</td>
      <td>1h 59m</td>
      <td>2017-10-24</td>
      <td>2017-10-27</td>
    </tr>
  </tbody>
</table>
</div>

<div class="language-python highlighter-rouge"><div class="highlight"><pre class="highlight"><code><span class="n">df</span><span class="p">.</span><span class="n">query</span><span class="p">(</span><span class="s">'title == "The Harvey Girls"'</span><span class="p">)</span>
</code></pre></div></div>

<div>
<style scoped="">
    .dataframe tbody tr th:only-of-type {
        vertical-align: middle;
    }

    .dataframe tbody tr th {
        vertical-align: top;
    }

    .dataframe thead th {
        text-align: right;
    }
</style>
<table border="1" class="dataframe">
  <thead>
    <tr style="text-align: right;">
      <th></th>
      <th>title</th>
      <th>year_or_season</th>
      <th>disc_or_duration</th>
      <th>ship_date</th>
      <th>return_date</th>
    </tr>
  </thead>
  <tbody>
    <tr>
      <th>mom_68</th>
      <td>The Harvey Girls</td>
      <td>1946</td>
      <td>1h 41m</td>
      <td>2021-12-13</td>
      <td>2021-12-20</td>
    </tr>
    <tr>
      <th>mom_69</th>
      <td>The Harvey Girls</td>
      <td>1946</td>
      <td>1h 41m</td>
      <td>2021-12-13</td>
      <td>2021-12-17</td>
    </tr>
  </tbody>
</table>
</div>

<div class="language-python highlighter-rouge"><div class="highlight"><pre class="highlight"><code><span class="c1"># Remove the extra rows
</span><span class="n">df</span> <span class="o">=</span> <span class="n">df</span><span class="p">.</span><span class="n">drop</span><span class="p">([</span><span class="s">'mom_69'</span><span class="p">,</span> <span class="s">'mom_446'</span><span class="p">])</span>
</code></pre></div></div>

<p>Ok, back to your regularly programmed visualization. I did a quick google and stumbled across a library called <a href="https://pythonhosted.org/calmap/">calmap</a> which seems to make Github-style calendars super easily. Heck yes, let’s give it a try!</p>

<h2 id="18-years-of-rentals">18 years of rentals</h2>

<div class="language-python highlighter-rouge"><div class="highlight"><pre class="highlight"><code><span class="n">fig</span><span class="p">,</span> <span class="n">ax</span> <span class="o">=</span> <span class="n">calmap</span><span class="p">.</span><span class="n">calendarplot</span><span class="p">(</span>
    <span class="n">data</span><span class="o">=</span><span class="n">df</span><span class="p">.</span><span class="n">groupby</span><span class="p">(</span><span class="s">'return_date'</span><span class="p">).</span><span class="n">size</span><span class="p">(),</span>
    <span class="n">vmin</span><span class="o">=</span><span class="mi">0</span><span class="p">,</span>
    <span class="n">ncols</span><span class="o">=</span><span class="mi">3</span><span class="p">,</span>
    <span class="n">fig_kws</span><span class="o">=</span><span class="p">{</span><span class="s">'figsize'</span><span class="p">:</span> <span class="p">(</span><span class="mi">15</span><span class="p">,</span> <span class="mi">10</span><span class="p">)},</span>
    <span class="n">yearlabel_kws</span><span class="o">=</span><span class="p">{</span><span class="s">'fontsize'</span><span class="p">:</span> <span class="mi">14</span><span class="p">,</span> <span class="s">'color'</span><span class="p">:</span> <span class="s">'gray'</span><span class="p">}</span>
<span class="p">)</span>
</code></pre></div></div>

<p><img src="/images/2023-04-20-netflix-dvd-history_files/2023-04-20-netflix-dvd-history_32_0.png" alt="png" /></p>

<h3 id="daily-rental-patterns">Daily rental patterns</h3>

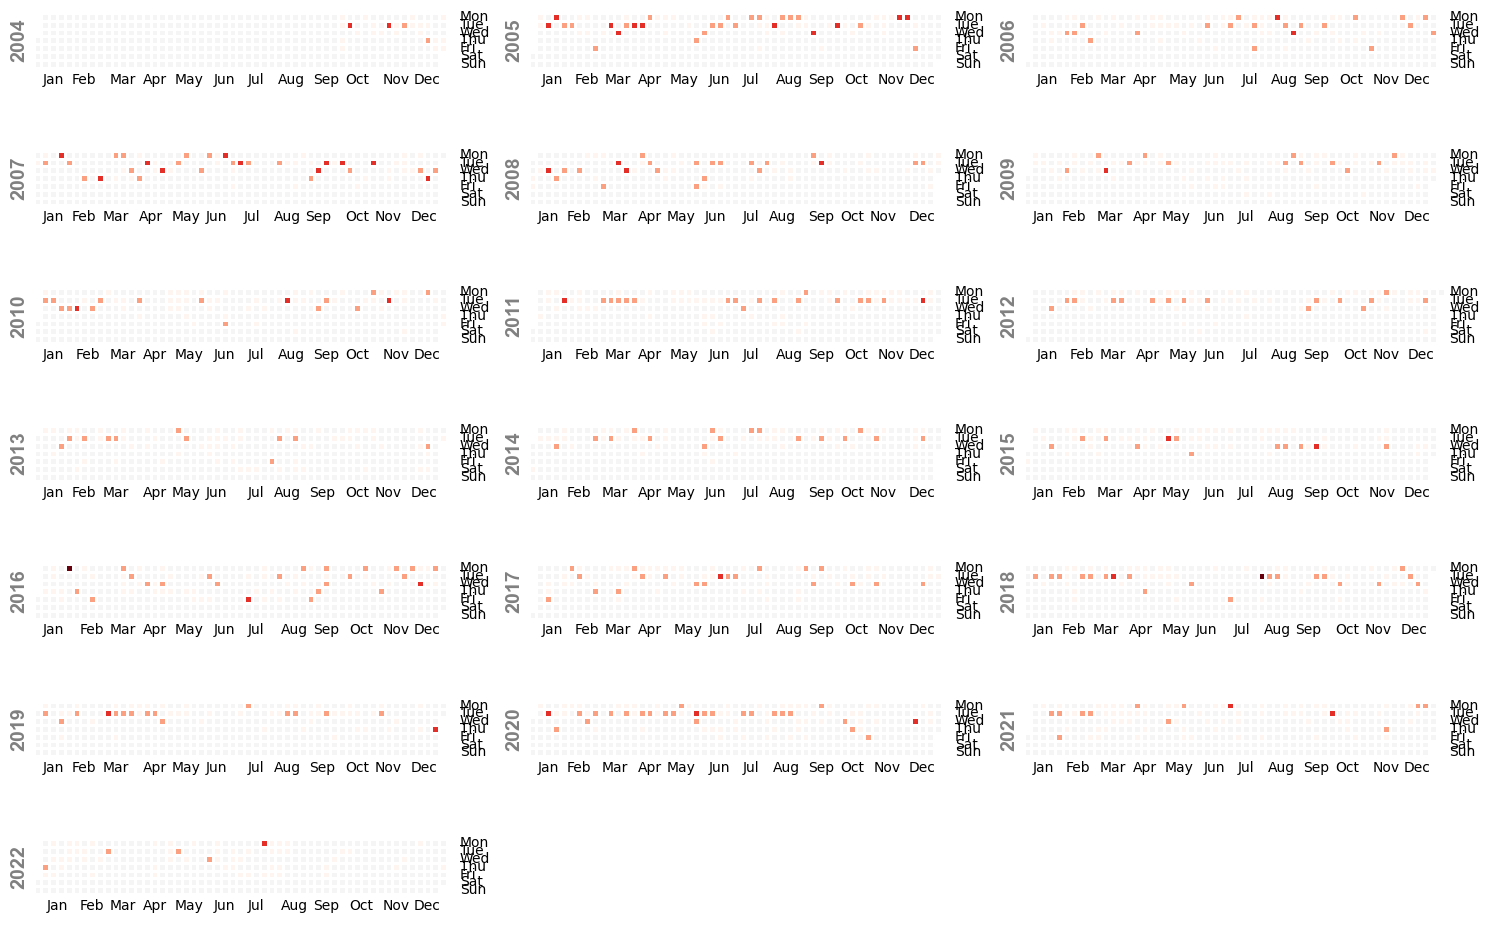
<p>First off, a quick guide to reading this sort of plot (which, despite staring at so many on Github, I’ve never really understood super well). Each plot shows 365 boxes, where each box is a day. Each row is a day of the week and each column is a week. The boxes are colored by how many DVDs were returned on that day (darker means more DVDs). So if you see a row with lots of filled-in boxes like a horizontal line, that means that we returned DVDs on the same day of the week across multiple weeks. Let’s say it’s the second row from the top, that would mean that Tuesdays are a frequent return day. Seeing a column of filled-in boxes would mean that we returned DVDs every day on a given week.</p>

<p>Ok, now that we’re oriented we can start to pick out some patterns. The first sort of pattern that sticks out to me is about which days we returned the DVDs. First, it looks like we rarely returned movies on two different days per week - you can see that there are very few columns with two filled-in boxes. Second, we never return DVDs on Saturday or Sunday (there are no filled-in boxes in the bottom two rows). It would make sense for Netflix’s DVD receiving department to be closed on weekends, so that checks out. Finally, it looks like our most frequent return day is Tuesday – that makes perfect sense! My parents tend to watch movies over the weekend, which means they would get picked up by USPS on Monday and received by Netflix the following Tuesday.</p>

<p>Another observation is that we would sometimes go months without returning any DVDs - you can see this as areas where there are multiple columns in a row of empty boxes. My guess is that these likely correspond to periods when my parents were on vacation, out of town, or otherwise busy. You can see examples of these gaps in June and July of a handful of years, which is what tipped me off to this vacation hypothesis. But there’s a lot of gaps, so I don’t think I’ll ask them to corroborate this hypothesis with the most recent dates of their big RV trips.</p>

<h3 id="return-day-consistency-seems-informative">Return day consistency seems informative</h3>

<p>Finally, the consistency of which days of the week we returned DVDs is intriguing - there are some years where it’s really consistent (the filled-in boxes are all on the same two-ish rows) and others where it’s not. From just looking at the plot, it seems that 2005-2009 didn’t have super consistent return days of the week - that makes sense, this was the period where I lived at home and had my own dedicated DVD (before the days of password sharing, this is how we shared accounts!). My guess is that I either watched movies on weekdays sometimes or, more likely, was less prompt at returning them after I watched them, which would explain the variety of return days.</p>

<p>The following 5 years, 2020-2015, had a much more consistent return day pattern, with most returned on Mondays or Tuesdays. This also makes sense, as this was the period where my parents were both empty nesters but still working: during this time, they would have been more likely to watch movies on the weekend than during the week, thus mailing them back on Mondays and Netflix receiving them on Tuesdays.</p>

<p>Then 2016 and 2017 are less consistent again - my guess is that this is right around when my mom retired. When I was talking to my parents about this analysis, my mom mentioned that when she first retired she watched a lot of TV series on Netflix DVDs. I also know that it took my parents a while to start paying for all the streaming services, so it would make sense that in these first few years after retirement you see a lot less consistency in the return days, as my mom was likely burning through TV shows via Netflix’s DVD service!</p>

<p>2018 and onwards gets decently consistent again. My hypothesis here is that 2018 is around when my parents started paying for and using streaming services, so they stopped watching as many movies and TV shows on Netflix DVDs. That would leave Netflix DVDs only for the more obscure foreign films or recently released movies not yet available on streaming that they wanted to watch, and everything else would have been watched via streaming. In this scenario, it makes sense that the behavior would revert to a consistent early-week return date: my dad was still working, and so I assume that they watched the movies that they ordered from Netflix on the weekends, and my mom watched other things during the week via streaming services.</p>

<p>Finally, 2021 and 2022 are slightly less consisetnt and much more sparse than any of the other years. My dad retired in December 2021, which is when my parents started taking a lot of trips in their RV. But I don’t think that’s what explains the sparseness - my guess is that they switched their plan from 3 DVDs to 1 sometime in 2021, which led to the slow death of their usage of the service.</p>

<h3 id="bring-in-the-parents-putting-my-hypotheses-to-the-test">Bring in the parents: putting my hypotheses to the test</h3>

<p>I texted my parents to see if I could confirm some of these hypotheses. First off, my mom retired in December 2015 – huzzah, I was right! Pretty cool that you can see her retirement just in the distribution of return days of the week.</p>

<p>Then, my dad told me that they had access to Netflix’s streaming as soon as it started in 2007, but my mom doesn’t think they started using it regularly until around 2015. My parents also got Apple TV Box in November 2020, which made streaming very easy across the various services. So that doesn’t check out with my “2018 is when they started streaming regularly” hypothesis - something else must have happened in 2018 that got them back to a more consistent DVD viewing pattern. Maybe my mom ran out of TV shows that Netflix had on DVD?</p>

<p>Finally, they switched to the plan with only 1 DVD in August 2022 - way after the 2021 sparseness started! So it must have gone the other way: their utilization was going down, and so they downgraded their plan.</p>

<h2 id="movie-quantity-over-time">Movie quantity over time</h2>

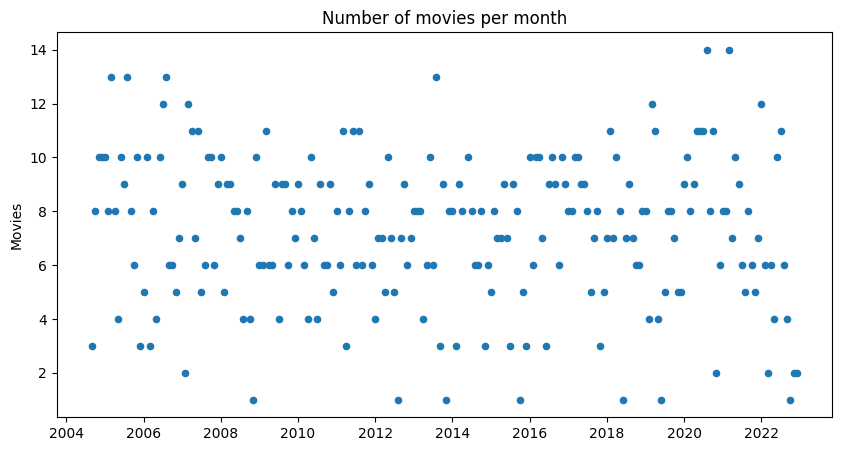
<p>Next up, I want to look at a more high-level summary of the amount of movies we watched. My guess is that we watched way more while I was still living at home, and then that it spiked again after my mom retired. I might also guess that my parents watched more movies in 2020 and 2021 during Covid, but I’m not sure if that would be reflect in the number of DVDs since that’s also when they were using streaming services.</p>

<div class="language-python highlighter-rouge"><div class="highlight"><pre class="highlight"><code><span class="c1"># Let's look at it monthly
</span><span class="n">df</span><span class="p">[</span><span class="s">'return_month'</span><span class="p">]</span> <span class="o">=</span> <span class="n">pd</span><span class="p">.</span><span class="n">to_datetime</span><span class="p">(</span><span class="n">df</span><span class="p">[</span><span class="s">'return_date'</span><span class="p">].</span><span class="n">dt</span><span class="p">.</span><span class="n">strftime</span><span class="p">(</span><span class="s">'%Y-%m'</span><span class="p">))</span>
</code></pre></div></div>

<div class="language-python highlighter-rouge"><div class="highlight"><pre class="highlight"><code><span class="n">movies_per_month</span> <span class="o">=</span> <span class="n">df</span><span class="p">.</span><span class="n">groupby</span><span class="p">(</span><span class="s">'return_month'</span><span class="p">).</span><span class="n">size</span><span class="p">().</span><span class="n">reset_index</span><span class="p">(</span><span class="n">name</span><span class="o">=</span><span class="s">'n_movies'</span><span class="p">)</span>
<span class="n">movies_per_month</span><span class="p">.</span><span class="n">head</span><span class="p">()</span>
</code></pre></div></div>

<div>
<style scoped="">
    .dataframe tbody tr th:only-of-type {
        vertical-align: middle;
    }

    .dataframe tbody tr th {
        vertical-align: top;
    }

    .dataframe thead th {
        text-align: right;
    }
</style>
<table border="1" class="dataframe">
  <thead>
    <tr style="text-align: right;">
      <th></th>
      <th>return_month</th>
      <th>n_movies</th>
    </tr>
  </thead>
  <tbody>
    <tr>
      <th>0</th>
      <td>2004-09-01</td>
      <td>3</td>
    </tr>
    <tr>
      <th>1</th>
      <td>2004-10-01</td>
      <td>8</td>
    </tr>
    <tr>
      <th>2</th>
      <td>2004-11-01</td>
      <td>10</td>
    </tr>
    <tr>
      <th>3</th>
      <td>2004-12-01</td>
      <td>10</td>
    </tr>
    <tr>
      <th>4</th>
      <td>2005-01-01</td>
      <td>10</td>
    </tr>
  </tbody>
</table>
</div>

<div class="language-python highlighter-rouge"><div class="highlight"><pre class="highlight"><code><span class="n">fig</span><span class="p">,</span> <span class="n">ax</span> <span class="o">=</span> <span class="n">plt</span><span class="p">.</span><span class="n">subplots</span><span class="p">(</span><span class="n">figsize</span><span class="o">=</span><span class="p">(</span><span class="mi">10</span><span class="p">,</span> <span class="mi">5</span><span class="p">))</span>
<span class="n">movies_per_month</span><span class="p">.</span><span class="n">plot</span><span class="p">(</span><span class="n">kind</span><span class="o">=</span><span class="s">'scatter'</span><span class="p">,</span> <span class="n">x</span><span class="o">=</span><span class="s">'return_month'</span><span class="p">,</span> <span class="n">y</span><span class="o">=</span><span class="s">'n_movies'</span><span class="p">,</span> <span class="n">ax</span><span class="o">=</span><span class="n">ax</span><span class="p">)</span>

<span class="n">ax</span><span class="p">.</span><span class="n">set_title</span><span class="p">(</span><span class="s">'Number of movies per month'</span><span class="p">)</span>
<span class="n">ax</span><span class="p">.</span><span class="n">set_ylabel</span><span class="p">(</span><span class="s">'Movies'</span><span class="p">)</span>
<span class="n">ax</span><span class="p">.</span><span class="n">set_xlabel</span><span class="p">(</span><span class="s">''</span><span class="p">)</span>
</code></pre></div></div>

<div class="language-plaintext highlighter-rouge"><div class="highlight"><pre class="highlight"><code>Text(0.5, 0, '')
</code></pre></div></div>

<p><img src="/images/2023-04-20-netflix-dvd-history_files/2023-04-20-netflix-dvd-history_37_1.png" alt="png" /></p>

<p>Welp, nope - doesn’t look like there’s any discernible pattern in terms of the number of movies we watched over the years. It’s very interesting to me that you don’t see any obvious decreases when I moved out or even when my parents bumped their plan down to one DVD per month (but maybe that’s because there isn’t enough data to see that).</p>

<p>I wonder how this compares to the maximum possible number of movies per month. Let’s do some back-of-the-envelope math!</p>

<p>Assuming:</p>
<ul>
  <li>we have a plan that lets us have 3 DVDs at a time</li>
  <li>we can only watch one movie per day</li>
  <li>it takes Netflix one day to process a returned movie and ship out the next one</li>
  <li>they send it with 2 day shipping to get to us</li>
  <li>and when we mail it back, it goes with overnight return shipping</li>
</ul>

<p>That means that each movie takes up a total of 5 days (1 day to be processed by Netflix + 2 days in the mail to get to us + 1 day to be watched + 1 day to return to Netflix). So each of the 3 DVDs can go through 6 full rental cycles per month, meaning that the max number of movies we could watch in a month is 18. On average, my family watched 7.3 movies per month – a little less than half of the possible rentals. But there were some months when we went through 14 movies, a 75% utilization rate! For a working family who definitely does not watch movies every day, not bad.</p>

<p>With that, thanks for joining me on this journey down Netflix memory lane! RIP Netflix DVD service, you were a true trailblazer ahead of your times, and those of us who were loyal fans for over 15 years thank you.</p>]]></content><author><name>Claire Duvallet</name><email>cduvallet@gmail.com</email></author><category term="data-science" /><category term="portfolio" /><summary type="html"><![CDATA[Soon, Netflix will be canceling its DVD-by-mail program, the original service that helped Netflix crush Blockbuster and got us used to watching movies on-demand from the comfort of our homes before streaming was a thing. Perhaps not coincidentally, my dad cancelled my family’s subscription to the DVD service this winter. As my brother wisely put it upon hearing my dad’s news, “Netflix can finally stop buying physical DVDs now that their last customer cancelled!”]]></summary></entry><entry><title type="html">Early startup employee lessons learned, part 4: adapting to your changing role</title><link href="https://cduvallet.github.io/posts/2023/02/early-startup-changing-role" rel="alternate" type="text/html" title="Early startup employee lessons learned, part 4: adapting to your changing role" /><published>2023-02-05T00:00:00-08:00</published><updated>2023-02-05T00:00:00-08:00</updated><id>https://cduvallet.github.io/posts/2023/02/early-startup-changing-role</id><content type="html" xml:base="https://cduvallet.github.io/posts/2023/02/early-startup-changing-role"><![CDATA[<p>In <a href="/posts/2022/12/early-startup-team-growth-culture">Part 3</a> of this series, I wrote about strategies to build a team with a positive organizational culture.
That post was about the team; this post is about you: as an early employee, how does your role change with the changing company and how can you gracefully ride that wave?
When I joined my company as the fifth person, I knew that if all went well and our company succeeded, I’d have a very interesting path within the organization.
What I didn’t know was any of the details of what that meant, and importantly what skills I’d need to gracefully walk that path.
This post is about the things I’ve learned over the past two years as we’ve grown from 5 to 100 employees, and as my role has undergone countless transformations in the process of growing our team and responding to the company’s needs.</p>

<p>In the past two years, I’ve done some aspect of almost every job that we currently have full-time employees for at my company, except for some of the sales and finance roles. 
Software engineering, data science, operations, customer success, people management, strategy, marketing - you name it, I probably touched on it at some point in our period of hypergrowth.
It’s been an amazing experience, but also a big challenge to grow and adapt my own role in the company as its needs have changed and as we’ve hired people to fill those needs on a full-time basis.
One of the most important aspects of being an early employee is recognizing your place within the company and adapting gracefully as that changes.</p>

<h2 id="letting-go-of-your-legos">Letting go of your legos</h2>

<p>A blog post about scaling a startup wouldn’t be complete without linking to the famous <a href="https://review.firstround.com/give-away-your-legos-and-other-commandments-for-scaling-startups">“Letting go of your legos” article</a>.
But seriously, hiring people to take over work that you can no longer sustain doing isn’t enough – it’s critical to be intentional about giving those people you hire the space to take over the things that used to be your job.</p>

<p>When I first read that “give away your legos” article, I thought it’d be a piece of cake because of course I wanted people to take my jobs, I was doing way too many of them!
But actually, I’ve learned that there’s more to it than that.
In my mind, there’s two parts to giving away your legos: the first is giving them away, which is fairly easy to do if you’re experiencing burnout or you’re not a high ego person.
The second is to let them make it their own, which is harder as an early employee because it means they might do a “worse” job of it than you.
They won’t have the full context you do or the years of experience you have building the processes or projects from scratch. 
But you have to let them take your legos, <em>and also</em> give them space to make it their own.</p>

<p>One thing that helps here is realizing that there is often no “best” way to do something.
It’s possible that the way they decide to do something is worse, or maybe it’s just different from how you’d do it.
It’s also possible that they take your hacked-together solution and make it better, since it’s now their <em>actual</em> job to do this thing that used to be one of your millions of jobs. 
Second, even if they do end up doing a “less good” job of something than you were doing, the company will still experience a net gain simply by having an improved <a href="https://en.wikipedia.org/wiki/Bus_factor">bus factor</a>.
For example, in my case, it was way worth having a slightly less accurate QC process because it meant that we could hire junior data analysts to do it instead of having multiple scientific PhDs spending hours of their time going through relatively rote QC.</p>

<h2 id="dont-grow-too-fast">Don’t grow too fast</h2>

<p>One of the benefits of joining a startup as an early employee is that it’s a great opportunity to supercharge your career growth and quickly get promoted. 
If you’re the first data scientist like I was, it’s really enticing to shoot for growing into the head of your department quickly.
But it might be more complicated than that: you might find yourself, as I did, in dire need of someone with more experience than you to help guide your work, so that you’re no longer learning by doing (and making mistakes) but instead having some seasoned perspective guiding your team.
You might also find out that managing teams isn’t what you want to do: the diplomacy and people management might not be your thing, and you might prefer to stay on an IC track and focus on technical problems.
That’s why it’s important to give yourself space to discover what you actually like, rather than rushing into a director-type role.</p>

<p>In my experience, I discovered that I actually don’t really like the internal diplomacy and relationship-leveraging needed to be an effective team lead.
I found myself much preferring wielding influence in my sphere, focusing on how my team can better work together rather than addressing broader strategy issues that require a lot of negotiation and mind-changing across teams.
I did end up in a team lead and management role for a lot of the past two years, but because I wasn’t ever officially promoted into a “Head of Data Science” or formal team lead role, I still had the flexibility to figure out where I wanted to end up.
I’m really grateful that my founder and various managers took this approach, because it made it really easy to end up where I am now: as a technical lead, wielding influence as a high-level IC but not as a people manager.
The other benefit is that we got to hire a great VP of Data Science who I’ve gotten to learn a lot from!</p>

<h2 id="common-inflection-points">Common inflection points</h2>

<p>If I look back on the past two years of growth and change in my role, I can identify a handful of inflection points.</p>

<p>First, I was alone: I was the only full-time data scientist and data engineer. We hired interns and contractors and  full-time junior folks to support me, but I was still alone. There was no one to bounce ideas off of, nobody to review my architecture decisions, no one at my level to commiserate with about the growing pains we were experiencing. It was exciting because I had so much influence, but it was also really lonely.</p>

<p>Then, we started building out our team: I wasn’t alone anymore, but I was in charge of everyone so I was still basically alone. Our interns and contractors evolved into full-time folks, but I was the one managing them all, the only point between our data scientists and our founder. This was less lonely, because I had other people to help do the work with me. But there were still a lot of things I couldn’t engage with these colleagues on because I was their manager, and it was still up to me to listen to their concerns and try to figure out something to do about them even if I was struggling with similar issues.</p>

<p>The third inflection point came when we hired even more people and re-organized our team – suddenly I had peers! In our case, two of the three senior folks I had been managing were promoted into management roles at my level and the third moved out of my reporting line. This was the biggest inflection point for me: suddenly, I had peers who I wasn’t managing on both technical IC and leadership work. I also finally had people I could commiserate with without censorship - my fellow group leads. At this point, maybe you’ll have hired a boss or maybe not. For us, we didn’t have a boss yet and that was fine - we were in constant communication and were able to present a solidified front to our leadership when needed. But the inflection point wasn’t about having a boss or not, it was really about about finally having peers.</p>

<p>Finally, the fourth inflection point is when I become just another employee (which is still ongoing). 
Now, my team is getting to the point where it’s larger than what I can directly control or even have influence over, there are people at the company who I don’t know, and there are multiple layers between me and the executives or primary decision-makers. I think that if you had told me about this inflection point three years ago when I joined, I would have feared it or been bummed about the idea of getting here. But now that I’m living through it, I love it. The fact that there are people at our company who don’t know me means that we are successfully growing and scaling, as I discussed in <a href="/posts/2022/11/early-startup-employee-coping">part 2</a> of this series.</p>

<h2 id="remaining-a-leader">Remaining a leader</h2>

<p>Even after this fourth inflection point when you’re finally just another employee, you’re not <em>really</em> just another employee.
There’s nothing that will change the fact that you were there when it started: you know the context, you have a lot of the scoops, you see the big picture in a way that many others may not.
Many folks will be excited to learn from you regardless of your actual role.</p>

<p>Your opinion will probably still matter a lot, at least to some people. You should be careful with it.
Interestingly, as our company has grown, I’ve made much more use of DM’s rather than public messages, despite being the queen of surfacing!
But as my role has changed, knowing that my words and actions carry a certain amount of weight is important.
So I’ll go to private messages first to share feedback, strategize responses to tricky situations, and make sure I’m not overstepping on somebody else’s work or opportunity to respond.</p>

<p>Additionally, even when you do become another employee and most new hires have no idea who you are, the people who were there when you were central to the company will still view you that way, even if you no longer are. 
So even as you grow and the majority of new folks don’t know who you are, you still have to recognize your potential impact, especially on folks from other teams who haven’t followed along with your changing role as closely - they have no idea what your job is now, but they still remember what your job was back then.
One concrete way this manifests is that you may still get tagged into questions and issues by those folks randomly here and there, since they may not know that entire teams have been hired to fulfill the role that you used to play.
When that happens, it’s your job to redirect them to the people and teams whose job it is to actually do those things now.</p>

<p>Finally, it’s important to recognize when it does make sense for you to step back up a play a larger part of issues than your new role may call for.
For me, this has come up in two ways: first, stepping up to coordinate large cross-functional or high-risk projects that need someone with a big picture view of the many different components of the business.
Second, when meeting new hires who have been brought on to tackle technical debt-related projects or other cross-functional work like program management, I find it important to make myself available to them and very explicitly offer up sharing the scoops.
Like my boss says, I know where the bodies are buried and that can be really useful to make sure we’re not making the same mistakes we’ve made in the past.
Most new hires don’t need to know about the bodies, but some do - and I make sure that they know I will happily give them the scoop any time they ask. 
Equally important is that I put the ball in their court - if they think that knowing the historical context will help them with their job, then they’ll reach out. 
But it’s possible that the historical context actually isn’t all that helpful to or wanted by them, in which case it’s important to respect that and let them do things their own way.
Like many things about growing and changing with your company, it’s all about balance.</p>

<p><em>If you liked this post, check out the rest of the series on being an early startup employee:</em></p>
<ul>
  <li><em><a href="/posts/2022/11/early-startup-employee-change">Part 1: affecting change within your org</a></em></li>
  <li><em><a href="/posts/2022/11/early-startup-employee-coping">Part 2: coping with the emotional rollercoaster</a></em></li>
  <li><em><a href="/posts/2022/12/early-startup-team-growth-culture">Part 3: building a team culture</a></em></li>
  <li><em><a href="/posts/2023/02/early-startup-changing-role">Part 4 (this post): adapting to your changing role</a></em></li>
</ul>]]></content><author><name>Claire Duvallet</name><email>cduvallet@gmail.com</email></author><summary type="html"><![CDATA[In Part 3 of this series, I wrote about strategies to build a team with a positive organizational culture. That post was about the team; this post is about you: as an early employee, how does your role change with the changing company and how can you gracefully ride that wave? When I joined my company as the fifth person, I knew that if all went well and our company succeeded, I’d have a very interesting path within the organization. What I didn’t know was any of the details of what that meant, and importantly what skills I’d need to gracefully walk that path. This post is about the things I’ve learned over the past two years as we’ve grown from 5 to 100 employees, and as my role has undergone countless transformations in the process of growing our team and responding to the company’s needs.]]></summary></entry><entry><title type="html">Early startup employee lessons learned, part 3: building culture</title><link href="https://cduvallet.github.io/posts/2022/12/early-startup-team-growth-culture" rel="alternate" type="text/html" title="Early startup employee lessons learned, part 3: building culture" /><published>2022-12-26T00:00:00-08:00</published><updated>2022-12-26T00:00:00-08:00</updated><id>https://cduvallet.github.io/posts/2022/12/team-building-lessons</id><content type="html" xml:base="https://cduvallet.github.io/posts/2022/12/early-startup-team-growth-culture"><![CDATA[<p>A core function of being an early employee at a rapidly growing startup is helping it grow!
At my current job, I’ve helped the data science team grow from being just one person doing a little bit of everything (me!) to a team of over 15 people working in three focused sub-teams.
Growing the data science team has been one of the best parts of my hyper-growth experience, and I’ve learned a lot of really useful lessons from it.</p>

<p>As I mentioned in <a href="/posts/2022/11/early-startup-employee-change">Part 1</a>, building an open and collaborative team culture on my team is one of my proudest achievements. 
Because I care a lot about organizational culture, a lot of this culture came about organically through my hiring decisions, early management role, and general positioning as an influential teammate.
But as I reflect on the past two years, I can identify some specific things we did that contributed to our positive outcome.</p>

<h1 id="communicating-about-how-we-communicate">Communicating about how we communicate</h1>

<p>Talking about how we communicate and then adapting our communication behaviors, processes, and norms as the team grew has helped us maintain a functional working culture despite our rapid growth.
I think this is also especially important given that we’re primarily remote: communication doesn’t come for free, it <em>has</em> to be an active effort. 
These efforts can be grouped into three categories: talking about communication, hiring for it, and implementing processes that encourage the meta-conversations.</p>

<h2 id="talk-about-it">Talk about it!</h2>

<p>First and foremost, our teams talks about how we talk to and work with each other. 
When someone posts a message and also asks “<em>is this the right channel to post this in?</em>”, folks on my team actually answer their question. It’s been interesting to notice this, because we’re one of the only teams at our company that I’ve seen actually engage with the meta-question, which I think stems from the norm we have of talking about how we talk to each other.</p>

<p>We also encourage holding each other accountable to the shared communication norms we’ve set - for example, a core value of our team is that we share unfinished work early and often. That means that when someone posts an unfinished analysis in one of our private channels, we encourage that person to re-post in a public channel where more of our team can engage with their work.</p>

<p>My favorite way that our team talks about how we communicate is by giving cute names to specific communication strategies we see others use effectively. So far, my favorites are:</p>
<ul>
  <li>“pulling a Claire” which means “asking someone to surface a private message in a public channel.”</li>
  <li>“pulling a Scott” which means “bring up an issue by making statements that nobody can disagree with and naively asking questions with the hopes of sparking the change you’d like to see.”</li>
  <li>“pulling a Nadia” which means “addressing a vague request by calmly asking for more details and links to documentation if it exists.”</li>
</ul>

<p>As we see our colleagues find ways to effectively communicate with us and others, we talk about what it is that makes them effective and learn from them.</p>

<h2 id="hire-for-communication">Hire for communication</h2>

<p>We also explicitly center communication in our hiring processes. 
One of my favorite things we ask our data science candidates is about sharing unfinished work. 
For example, we ask “how comfortable would you be sharing an analysis that isn’t fully polished to the CEO?” or “how do you know when your work is ready to share internally vs. externally?”
With these questions, we’re gauging candidates’ approach toward sharing unfinished work and trying to understand their ability to make decisions on partial information, which are both critical parts of our culture and key to being successful data scientists at our company.</p>

<p>Also, our technical interviews usually consist of some sort of pairing exercise or hypothetical scenarios - when we walk candidates through these, we emphasize over and over that we’re less interested in their answers and more in hearing their questions and thought processes.
If candidates jump straight to answers, we’ll explicitly reorient them to questions, asking them point-blank what sorts of questions they’d need to ask their users or stakeholders.
At the end of day, candidates who don’t ask us any questions never get hired by our panels, and I find that we get much better signal on their technical ability from the questions they ask than the answers they give.</p>

<h2 id="implement-processes-to-encourage-meta-conversations">Implement processes to encourage meta-conversations</h2>

<p>Finally, our team has explicit processes that encourage the conversations about communication.
Some of my favorite examples of these are:</p>

<p><strong>Sprint retros</strong>: we started using a baby version of agile when had zero project management expertise at the company, and we basically just made it up as we went along. One thing that sticks out to me from those early agile days was the retros: it was the first time we’d had a structured place to talk not just about the work that we did, but also <em>how</em> we did the work that we did. Importantly, because it was a semi-formal environment, it was all intentionally constructive: when we talked about what went well and not so well, we brainstormed <em>together</em> about how to improve the way that we do work. I think this really set the stage for our team’s culture of interrogating and then collaborating on solving our organizational problems.</p>

<p><strong>Intentional slack channels</strong>: for a long time, we basically had two channels: one called #data for all public data-related things, and one #data-team-internal private channel for internal banter and existential “omg is all of our data wrong” conversations. We also had legacy product-specific #data-XX channels that nobody really knew how to use. As we grew, that wasn’t working for us anymore - the #data channel was cluttered with inbound requests from non-data science team members, and our posts with results and analyses weren’t getting enough engagement because the channel was just too busy. We were also worried about posting jargon-heavy or unpolished analyses in #data because we knew there were so many non-technical eyes on it, and so a lot of our work had started going to our private channel, which ran counter to our values of transparency and collaboration.</p>

<p>At that point, three sub-teams within the data science team had started to form, and so we decided to create intentional public channels for each team. We talked about it extensively within the data science team, and then made an announcement to the company: what channels we were deprecating, what channels we were creating, and - importantly - <em>what each channel was for</em>. We were very clear: our team-specific channels would be just for us, with unpolished and sometimes incorrect work or analyses - lurk at your own risk! This re-organization and intention-setting freed us from the paralysis of not knowing where to post, improved our ability to collaborate by removing our fear of unintended consequences, and also helped the broader organization learn how to engage with us more effectively.</p>

<p><strong>Intention-setting disclaimers on documents</strong>: this one is the brainchild of a former colleague, but the majority of our team has since adopted it. Whenever we shared a document in a public channel, we add a disclaimer to the top indicating where this document is in its lifecycle (WIP, draft, ready for review, etc), what we want from folks who look at the doc (hold your comments, comments welcome), and whether we are comfortable with others circulating the document (circulation OK, do not circulate). These disclaimers are especially helpful when you’re working on something that you know a lot of people will have <em>feelings</em> about, but you don’t want to keep it a secret until it’s finished. It helps us act in the transparent way that we value while minimizing potential negative consequences from other teams who aren’t necessarily used to working this way. As a consumer of documents, I also find it extremely helpful to know what the author wants from me: should I hold my tongue, or are they ready for feedback? Can I share this broadly, or are they not ready for this to be disseminated yet?</p>

<h1 id="intentional-onboarding">Intentional onboarding</h1>

<p>Another easy way to build a positive and collaborative culture is to bake your team’s values into standard onboarding tasks.
Preparing a plan for new hires’ first 30, 60, and 90 days of their job is great, but realistically you only need a plan for the first 2-4 weeks. 
After that, things will have probably changed enough either with the company or with the new hire figuring out where they fit in their new role that a new path will have become clear.
Instead, putting in effort to create standardized and intentional onboarding tasks that immediately ask new hires to put your team’s core values into practice is a great use of energy that may have more impact than individualized long-term planning.</p>

<p>On our team, onboarding involves two core activities: meeting a lot of people and making a plot.
When we set up intro meetings for new hires, we intentionally go for a broader circle than the individuals they’ll be working with directly.
As a team, we value collaboration and compassion, which means that we want our data scientists to understand how their work fits into the broader company and how they can help support others beyond the data science team.
So during onboarding, we make sure to encourage meetings with not just close colleagues, but also nearby teams and individuals from unrelated teams who they would benefit from having met at least once.</p>

<p>The other part of onboarding, which I love, is to make a plot. 
We give every new hire the same ticket their first sprint: make a plot, any plot! 
Just get access to our data somehow, make a plot that shows anything at all, and post it in our public team channel.
This activity emphasizes our values of transparency and collaboration.
If folks post it in our private channel, we remind them that the task was to post it publicly; if they take a long time to post it because they haven’t found anything “interesting,” we remind them that the task is to make <em>literally any plot at all</em> and post it.
By emphasizing the public channel and the <em>literally any plot at all</em>, we get new hires comfortable with sharing unfinished work publicly, which is core to how we want to work together.
Importantly, we ask everybody to do this task - even our head of data science! 
By doing so, we encourage new hires to put our values immediately into practice, and show that the values are team-wide and that we’re serious about them.</p>

<h1 id="be-the-broken-record">Be the broken record</h1>

<p>Finally, something I didn’t realize I was doing at the time but which I think has been very helpful in shaping our culture is to constantly give my team the rationale behind what I’m doing and what I see our company doing. 
I think that explaining the “why” behind decisions that we’re making helps build an engaged team.
For example, helping individual contributors understand why the company is making certain decisions or prioritizing certain projects can help provide additional motivation and context for the work they’re being asked to do.
And as an early employee and leader, explaining my thought processes behind my decisions can teach and empower others to learn how to make those decisions themselves in the future, thus scaling my influence without stretching me thinner.</p>

<p>For example, I was originally responsible for the team QC’ing our data.
Part of that was to work with our QC analysts and customer success teams to decide how to approach tricky situations, for example if a customer’s results seemed a little wonky and we didn’t know whether to just release the results or also send along a pre-emptive explanatory note. 
Rather than just telling my team of junior analysts what I thought the right thing to do was, I would walk them through my thought process. 
After a few months of this, instead of tagging me in to make the decisions, they started applying the same thought process themselves and tagging me in to just confirm the answer they’d gotten to themselves.
There’s nothing better than messages like that, I can tell you!</p>

<p>Because I repeated myself to the point of being the voice in their heads, I’ve been able to step away from these day-to-day decisions with basically no impact to the quality of their work. 
Of course, explicit training and documentation would probably be a better way to scale my knowledge, but at rapidly growing startups there sometimes isn’t time for that - and simply being a broken record is often a good substitute.</p>

<p>When in doubt, I’ve found that clearly spelling out the “why” behind what we’re doing can be a great substitute for process and documentation, and is a good way to help others connect the dots themselves and understand the bigger picture behind what they’re being asked to do.</p>

<p><em>If you liked this post, check out the rest of the series on being an early startup employee:</em></p>
<ul>
  <li><em><a href="/posts/2022/11/early-startup-employee-change">Part 1: affecting change within your org</a></em></li>
  <li><em><a href="/posts/2022/11/early-startup-employee-coping">Part 2: coping with the emotional rollercoaster</a></em></li>
  <li><em><a href="/posts/2022/12/early-startup-team-growth-culture">Part 3 (this post): building a team culture</a></em></li>
  <li><em><a href="/posts/2023/02/early-startup-changing-role">Part 4: adapting to your changing role</a></em></li>
</ul>]]></content><author><name>Claire Duvallet</name><email>cduvallet@gmail.com</email></author><summary type="html"><![CDATA[A core function of being an early employee at a rapidly growing startup is helping it grow! At my current job, I’ve helped the data science team grow from being just one person doing a little bit of everything (me!) to a team of over 15 people working in three focused sub-teams. Growing the data science team has been one of the best parts of my hyper-growth experience, and I’ve learned a lot of really useful lessons from it.]]></summary></entry><entry><title type="html">The Boston morning commute time warp</title><link href="https://cduvallet.github.io/posts/2022/12/boston-nh-commute-time-warp" rel="alternate" type="text/html" title="The Boston morning commute time warp" /><published>2022-12-11T00:00:00-08:00</published><updated>2022-12-11T00:00:00-08:00</updated><id>https://cduvallet.github.io/posts/2022/12/boston-nh-commute</id><content type="html" xml:base="https://cduvallet.github.io/posts/2022/12/boston-nh-commute-time-warp"><![CDATA[<p>Like many young adults our age, my partner and I did the classic pandemic move of fleeing the city and moving in with his parents. That’s how I discovered I actually really enjoy living in rural New Hampshire, and last December we officially moved in to our own place in southern New Hampshire.</p>

<p>While we work from home the majority of the time, there are still some days here and there where we drive in to Boston. One thing I’ve noticed is that there seems to be a time warp during Boston morning traffic, where it is physically impossible to arrive in Boston between a certain time period. And that time period happens to be around when you’d usually want to get in, roughly when work starts in the morning.</p>

<p>After finding myself puzzling over the optimal time to leave to get to Boston early but without spending too much unnecessary extra time in the car, I decided to look into it - with data!</p>

<p>I was hoping that there would be a google maps API or something I could use to programmatically generate a bunch of travel time estimates for the route between my house and Central Square, where I work. Unfortunately, it turns out that (1) the google maps API isn’t free (though there is a “free tier” up to a certain number of queries) and (2) using it to grab data without showing an accompanying map violates the API <a href="https://cloud.google.com/maps-platform/terms/">terms of service</a> (section 3.2.3).</p>

<p>So instead, I just manually “generated” the data by inputting my destination and modifying the departure date and time. I collected data on the two primary routes I can take, one via I-93 S and the other via route 3, and covered times between 5 am and 10 am, which matches my intuition for when the Boston traffic time warp is. Because this was very manual data collection, I only did this for 5 days, from 9/12 to 9/16. For each date and time of departure, I tracked the google maps estimate of the shortest &amp; longest duration, as well as what color those estimates were (like when the google maps estimate is red and you know you’re in for miserable traffic, that would be “red”).</p>

<p>The data I gathered looked like this:</p>

<div class="language-python highlighter-rouge"><div class="highlight"><pre class="highlight"><code><span class="kn">import</span> <span class="nn">pandas</span> <span class="k">as</span> <span class="n">pd</span>

<span class="kn">import</span> <span class="nn">matplotlib.pyplot</span> <span class="k">as</span> <span class="n">plt</span>
<span class="kn">import</span> <span class="nn">matplotlib.dates</span> <span class="k">as</span> <span class="n">mdates</span>

<span class="kn">import</span> <span class="nn">seaborn</span> <span class="k">as</span> <span class="n">sns</span>

<span class="kn">from</span> <span class="nn">datetime</span> <span class="kn">import</span> <span class="n">timedelta</span>
</code></pre></div></div>

<div class="language-python highlighter-rouge"><div class="highlight"><pre class="highlight"><code><span class="n">df</span> <span class="o">=</span> <span class="n">pd</span><span class="p">.</span><span class="n">read_csv</span><span class="p">(</span><span class="s">'Commute - NH - Boston.csv'</span><span class="p">)</span>
<span class="n">df</span><span class="p">.</span><span class="n">head</span><span class="p">()</span>
</code></pre></div></div>

<div>
<style scoped="">
    .dataframe tbody tr th:only-of-type {
        vertical-align: middle;
    }

    .dataframe tbody tr th {
        vertical-align: top;
    }

    .dataframe thead th {
        text-align: right;
    }
</style>
<table border="1" class="dataframe">
  <thead>
    <tr style="text-align: right;">
      <th></th>
      <th>date</th>
      <th>depart_time</th>
      <th>travel_time_min</th>
      <th>travel_time_max</th>
      <th>color</th>
      <th>route</th>
    </tr>
  </thead>
  <tbody>
    <tr>
      <th>0</th>
      <td>2022-09-12</td>
      <td>5:00 AM</td>
      <td>1h25</td>
      <td>1h50</td>
      <td>green</td>
      <td>route 3</td>
    </tr>
    <tr>
      <th>1</th>
      <td>2022-09-12</td>
      <td>5:00 AM</td>
      <td>1h40</td>
      <td>2h10</td>
      <td>green</td>
      <td>93</td>
    </tr>
    <tr>
      <th>2</th>
      <td>2022-09-13</td>
      <td>5:00 AM</td>
      <td>1h40</td>
      <td>2h20</td>
      <td>green</td>
      <td>93</td>
    </tr>
    <tr>
      <th>3</th>
      <td>2022-09-13</td>
      <td>5:00 AM</td>
      <td>1h30</td>
      <td>2h20</td>
      <td>green</td>
      <td>route 3</td>
    </tr>
    <tr>
      <th>4</th>
      <td>2022-09-14</td>
      <td>5:00 AM</td>
      <td>1h30</td>
      <td>2h</td>
      <td>green</td>
      <td>route 3</td>
    </tr>
  </tbody>
</table>
</div>

<p>Without even doing any data analysis, the first thing that struck me was that the estimates all seemed quite low. From personal anecdotal experience these maximum travel times feel more like optimistic estimates - it often takes 30-45 min longer than the initial expected arrival time, sometimes up to 60 min longer. The minimum time feels right - without any traffic, it’s about an hour and half. But even just the other day I drove into Boston and found myself stuck at Boston’s worst intersection - the one where you’re getting off I-90 east to get into Cambridge, that starts with a stressful left exit and goes into the terrible confusing traffic light intersection across the bridge onto River St. To be fair, I used to live <em>right</em> by that intersection so I really should have known better than be swayed by the supposedly shorter route 3 way, but alas. Anyway, that traffic alone added at least 20 minutes to my commute, and all at the very end of my trip so it felt like I was in a time warp with my estimated travel time staying the same while the minutes passed by.</p>

<p>The coloring also feels quite off, with the vast majority being green or orange and only a couple of commutes in the red. I would have expected many more of these time periods to be “red”. But maybe that’s reserved only for when Google knows that there’s <em>currently</em> an accident or other blockage? Because every single day I’ve driven in to Boston, the time estimate has turned red for at least part of my trip (if not the entire last third).</p>

<p>Anyway, let’s see what the data says! First, I have to do some wrangling to get all the dates and times processed in a way that will be amenable to plotting:</p>

<div class="language-python highlighter-rouge"><div class="highlight"><pre class="highlight"><code><span class="c1"># Convert travel times to minutes
</span><span class="k">def</span> <span class="nf">convert_to_minutes</span><span class="p">(</span><span class="n">s</span><span class="p">):</span>
    <span class="n">s</span> <span class="o">=</span> <span class="n">s</span><span class="p">.</span><span class="n">split</span><span class="p">(</span><span class="s">'h'</span><span class="p">)</span>
    <span class="n">mins</span> <span class="o">=</span> <span class="nb">float</span><span class="p">(</span><span class="n">s</span><span class="p">[</span><span class="mi">0</span><span class="p">])</span><span class="o">*</span><span class="mi">60</span>
    <span class="k">if</span> <span class="n">s</span><span class="p">[</span><span class="mi">1</span><span class="p">]:</span>
        <span class="n">mins</span> <span class="o">+=</span> <span class="nb">float</span><span class="p">(</span><span class="n">s</span><span class="p">[</span><span class="mi">1</span><span class="p">])</span>
    <span class="k">return</span> <span class="n">mins</span>

<span class="n">df</span><span class="p">[</span><span class="s">'travel_time_min_minutes'</span><span class="p">]</span> <span class="o">=</span> <span class="n">df</span><span class="p">[</span><span class="s">'travel_time_min'</span><span class="p">].</span><span class="nb">apply</span><span class="p">(</span><span class="k">lambda</span> <span class="n">x</span><span class="p">:</span> <span class="n">convert_to_minutes</span><span class="p">(</span><span class="n">x</span><span class="p">))</span>
<span class="n">df</span><span class="p">[</span><span class="s">'travel_time_max_minutes'</span><span class="p">]</span> <span class="o">=</span> <span class="n">df</span><span class="p">[</span><span class="s">'travel_time_max'</span><span class="p">].</span><span class="nb">apply</span><span class="p">(</span><span class="k">lambda</span> <span class="n">x</span><span class="p">:</span> <span class="n">convert_to_minutes</span><span class="p">(</span><span class="n">x</span><span class="p">))</span>

<span class="c1"># Calculate estimated arrivals
</span><span class="n">df</span><span class="p">[</span><span class="s">'depart_datetime'</span><span class="p">]</span> <span class="o">=</span> <span class="n">pd</span><span class="p">.</span><span class="n">to_datetime</span><span class="p">(</span><span class="n">df</span><span class="p">[</span><span class="s">'date'</span><span class="p">]</span> <span class="o">+</span> <span class="s">' '</span> <span class="o">+</span> <span class="n">df</span><span class="p">[</span><span class="s">'depart_time'</span><span class="p">])</span>
<span class="n">df</span><span class="p">[</span><span class="s">'arrival_time_min'</span><span class="p">]</span> <span class="o">=</span> <span class="n">df</span><span class="p">.</span><span class="nb">apply</span><span class="p">(</span>
    <span class="k">lambda</span> <span class="n">row</span><span class="p">:</span> <span class="n">row</span><span class="p">[</span><span class="s">'depart_datetime'</span><span class="p">]</span> <span class="o">+</span> <span class="n">timedelta</span><span class="p">(</span><span class="n">minutes</span><span class="o">=</span><span class="n">row</span><span class="p">[</span><span class="s">'travel_time_min_minutes'</span><span class="p">]),</span>
    <span class="n">axis</span><span class="o">=</span><span class="mi">1</span>
<span class="p">)</span>
<span class="n">df</span><span class="p">[</span><span class="s">'arrival_time_max'</span><span class="p">]</span> <span class="o">=</span> <span class="n">df</span><span class="p">.</span><span class="nb">apply</span><span class="p">(</span>
    <span class="k">lambda</span> <span class="n">row</span><span class="p">:</span> <span class="n">row</span><span class="p">[</span><span class="s">'depart_datetime'</span><span class="p">]</span> <span class="o">+</span> <span class="n">timedelta</span><span class="p">(</span><span class="n">minutes</span><span class="o">=</span><span class="n">row</span><span class="p">[</span><span class="s">'travel_time_max_minutes'</span><span class="p">]),</span>
    <span class="n">axis</span><span class="o">=</span><span class="mi">1</span>
<span class="p">)</span>

<span class="c1"># Give times a dummy date, since I want to just compare times regardless of day of the week
</span><span class="n">df</span><span class="p">[</span><span class="s">'depart_datetime_nodate'</span><span class="p">]</span> <span class="o">=</span> <span class="n">df</span><span class="p">[</span><span class="s">'depart_datetime'</span><span class="p">].</span><span class="nb">apply</span><span class="p">(</span><span class="k">lambda</span> <span class="n">d</span><span class="p">:</span> <span class="n">d</span><span class="p">.</span><span class="n">replace</span><span class="p">(</span><span class="n">year</span><span class="o">=</span><span class="mi">2022</span><span class="p">,</span> <span class="n">month</span><span class="o">=</span><span class="mi">9</span><span class="p">,</span> <span class="n">day</span><span class="o">=</span><span class="mi">8</span><span class="p">))</span>
<span class="n">df</span><span class="p">[</span><span class="s">'arrival_time_max_nodate'</span><span class="p">]</span> <span class="o">=</span> <span class="n">df</span><span class="p">[</span><span class="s">'arrival_time_max'</span><span class="p">].</span><span class="nb">apply</span><span class="p">(</span><span class="k">lambda</span> <span class="n">d</span><span class="p">:</span> <span class="n">d</span><span class="p">.</span><span class="n">replace</span><span class="p">(</span><span class="n">year</span><span class="o">=</span><span class="mi">2022</span><span class="p">,</span> <span class="n">month</span><span class="o">=</span><span class="mi">9</span><span class="p">,</span> <span class="n">day</span><span class="o">=</span><span class="mi">8</span><span class="p">))</span>
<span class="n">df</span><span class="p">[</span><span class="s">'arrival_time_min_nodate'</span><span class="p">]</span> <span class="o">=</span> <span class="n">df</span><span class="p">[</span><span class="s">'arrival_time_min'</span><span class="p">].</span><span class="nb">apply</span><span class="p">(</span><span class="k">lambda</span> <span class="n">d</span><span class="p">:</span> <span class="n">d</span><span class="p">.</span><span class="n">replace</span><span class="p">(</span><span class="n">year</span><span class="o">=</span><span class="mi">2022</span><span class="p">,</span> <span class="n">month</span><span class="o">=</span><span class="mi">9</span><span class="p">,</span> <span class="n">day</span><span class="o">=</span><span class="mi">8</span><span class="p">))</span>
</code></pre></div></div>

<p>Let’s start with the simplest possible thing - what’s the relationship between the time I leave and the duration of the trip?</p>

<div class="language-python highlighter-rouge"><div class="highlight"><pre class="highlight"><code><span class="n">ax</span> <span class="o">=</span> <span class="n">sns</span><span class="p">.</span><span class="n">scatterplot</span><span class="p">(</span><span class="n">data</span><span class="o">=</span><span class="n">df</span><span class="p">,</span> <span class="n">x</span><span class="o">=</span><span class="s">'depart_datetime_nodate'</span><span class="p">,</span> <span class="n">y</span><span class="o">=</span><span class="s">'travel_time_max_minutes'</span><span class="p">,</span> <span class="n">alpha</span><span class="o">=</span><span class="mf">0.5</span><span class="p">)</span>
<span class="n">ax</span><span class="p">.</span><span class="n">set_xlim</span><span class="p">([</span><span class="n">pd</span><span class="p">.</span><span class="n">to_datetime</span><span class="p">(</span><span class="s">'2022-09-08 04:30:00'</span><span class="p">),</span> <span class="n">pd</span><span class="p">.</span><span class="n">to_datetime</span><span class="p">(</span><span class="s">'2022-09-08 10:00:00'</span><span class="p">)])</span>

<span class="n">ax</span><span class="p">.</span><span class="n">set_xlabel</span><span class="p">(</span><span class="s">'Departure time (A.M.)'</span><span class="p">)</span>
<span class="n">ax</span><span class="p">.</span><span class="n">xaxis</span><span class="p">.</span><span class="n">set_major_formatter</span><span class="p">(</span><span class="n">mdates</span><span class="p">.</span><span class="n">DateFormatter</span><span class="p">(</span><span class="s">'%H:%M'</span><span class="p">))</span>

<span class="n">ax</span><span class="p">.</span><span class="n">set_ylabel</span><span class="p">(</span><span class="s">'Max total travel time (minutes)'</span><span class="p">)</span>
</code></pre></div></div>

<p><img src="/images/2022-09-08-boston-nh-commute_files/2022-09-08-boston-nh-commute_6_1.png" alt="png" /></p>

<p>Ok, so anywhere from two to three hours - that checks out. Already here you can see one of the key points of this whole thing: the range of possible durations for the same departure time is huge! For example, leaving at 6:30 am can take anywhere from 130 to 180 minutes - that’s an hour difference for the same departure time!</p>

<p>Next up, let’s see which route seems to be faster:</p>

<div class="language-python highlighter-rouge"><div class="highlight"><pre class="highlight"><code><span class="n">route_df</span> <span class="o">=</span> <span class="n">df</span><span class="p">.</span><span class="n">pivot</span><span class="p">(</span>
    <span class="n">index</span><span class="o">=</span><span class="s">'depart_datetime'</span><span class="p">,</span> <span class="n">columns</span><span class="o">=</span><span class="s">'route'</span><span class="p">,</span> <span class="n">values</span><span class="o">=</span><span class="s">'travel_time_max_minutes'</span>
<span class="p">)</span>

<span class="n">fig</span><span class="p">,</span> <span class="n">ax</span> <span class="o">=</span> <span class="n">plt</span><span class="p">.</span><span class="n">subplots</span><span class="p">()</span>
<span class="n">ax</span><span class="p">.</span><span class="n">plot</span><span class="p">([</span><span class="mi">110</span><span class="p">,</span> <span class="mi">180</span><span class="p">],</span> <span class="p">[</span><span class="mi">110</span><span class="p">,</span> <span class="mi">180</span><span class="p">],</span> <span class="n">color</span><span class="o">=</span><span class="s">'gray'</span><span class="p">,</span> <span class="n">linestyle</span><span class="o">=</span><span class="s">'--'</span><span class="p">,</span> <span class="n">alpha</span><span class="o">=</span><span class="mf">0.25</span><span class="p">)</span>
<span class="n">ax</span> <span class="o">=</span> <span class="n">route_df</span><span class="p">.</span><span class="n">plot</span><span class="p">(</span><span class="n">kind</span><span class="o">=</span><span class="s">'scatter'</span><span class="p">,</span> <span class="n">x</span><span class="o">=</span><span class="s">'route 3'</span><span class="p">,</span> <span class="n">y</span><span class="o">=</span><span class="s">'93'</span><span class="p">,</span> <span class="n">ax</span><span class="o">=</span><span class="n">ax</span><span class="p">)</span>

<span class="n">ax</span><span class="p">.</span><span class="n">set_title</span><span class="p">(</span><span class="s">'Route comparisons'</span><span class="p">)</span>
<span class="n">ax</span><span class="p">.</span><span class="n">set_xlabel</span><span class="p">(</span><span class="s">'Route 3 travel time (min)'</span><span class="p">)</span>
<span class="n">ax</span><span class="p">.</span><span class="n">set_ylabel</span><span class="p">(</span><span class="s">'I-93 S travel time (min)'</span><span class="p">)</span>
</code></pre></div></div>

<p><img src="/images/2022-09-08-boston-nh-commute_files/2022-09-08-boston-nh-commute_8_1.png" alt="png" /></p>

<p>Interesting, this data seems to indicate that the routes are roughly equivalent but the I-93 route often takes longer than going on Route 3. While I see how a computer would think this, as a human it really doesn’t check out.</p>

<p>What I think might be going on here is that I-93 has more predictable traffic than Route 3, both in terms of locations and amount, and so its estimates are taking into account that traffic while the Route 3 estimates aren’t able to.
Perhaps it <em>would</em> make sense for Google’s algorithm to incorporate its confidence in the amount &amp; location of traffic when it gives you estimates for travel <em>in the future</em>. For a computer, the training data is likely very clear: 93 south has traffic in the same spots every single day. It’s easy to measure and very consistent, and therefore very very predictable. Route 3, on the other hand, <em>theoretically</em> should have less traffic because it’s <em>not</em> the main thoroughfare into Boston - the route goes through Nashua and then veers west to go around Boston before taking I-90 East back into Cambridge. Of course, though, there’s always traffic or accidents on this route - it’s just that maybe the traffic isn’t always in the exact same spot and so the algorithm isn’t confident enough in it to incorporate it in its predictions. (Though if you ask me, that gnarly intersection has always been <em>predictably</em> awful and Google always underestimates how much time it adds - it should have been incorporated into the algorithm by now! Come on neural nets, get it together!)</p>

<p>Anyway, let’s get directly to our question: is it possible to reliably arrive at a reasonable morning working time, or does the Boston traffic time warp make that a physical impossibility?</p>

<div class="language-python highlighter-rouge"><div class="highlight"><pre class="highlight"><code><span class="n">g</span> <span class="o">=</span> <span class="n">sns</span><span class="p">.</span><span class="n">FacetGrid</span><span class="p">(</span><span class="n">data</span><span class="o">=</span><span class="n">df</span><span class="p">,</span> <span class="n">col</span><span class="o">=</span><span class="s">'route'</span><span class="p">,</span> <span class="n">aspect</span><span class="o">=</span><span class="mf">1.5</span><span class="p">)</span>

<span class="n">g</span><span class="p">.</span><span class="nb">map</span><span class="p">(</span><span class="n">sns</span><span class="p">.</span><span class="n">scatterplot</span><span class="p">,</span> <span class="s">'depart_datetime_nodate'</span><span class="p">,</span> <span class="s">'arrival_time_max_nodate'</span><span class="p">)</span>

<span class="k">for</span> <span class="n">ax</span> <span class="ow">in</span> <span class="n">g</span><span class="p">.</span><span class="n">axes</span><span class="p">.</span><span class="n">flatten</span><span class="p">():</span>
    <span class="n">ax</span><span class="p">.</span><span class="n">set_xlim</span><span class="p">([</span><span class="n">pd</span><span class="p">.</span><span class="n">to_datetime</span><span class="p">(</span><span class="s">'2022-09-08 04:30:00'</span><span class="p">),</span> <span class="n">pd</span><span class="p">.</span><span class="n">to_datetime</span><span class="p">(</span><span class="s">'2022-09-08 10:00:00'</span><span class="p">)])</span>
    <span class="n">ax</span><span class="p">.</span><span class="n">set_ylim</span><span class="p">([</span><span class="n">pd</span><span class="p">.</span><span class="n">to_datetime</span><span class="p">(</span><span class="s">'2022-09-08 06:30:00'</span><span class="p">),</span> <span class="n">pd</span><span class="p">.</span><span class="n">to_datetime</span><span class="p">(</span><span class="s">'2022-09-08 12:00:00'</span><span class="p">)])</span>
<span class="c1">#    ax.legend(loc='lower right')
</span>
    <span class="n">ax</span><span class="p">.</span><span class="n">xaxis</span><span class="p">.</span><span class="n">set_major_formatter</span><span class="p">(</span><span class="n">mdates</span><span class="p">.</span><span class="n">DateFormatter</span><span class="p">(</span><span class="s">'%H:%M'</span><span class="p">))</span>
    <span class="n">ax</span><span class="p">.</span><span class="n">yaxis</span><span class="p">.</span><span class="n">set_major_formatter</span><span class="p">(</span><span class="n">mdates</span><span class="p">.</span><span class="n">DateFormatter</span><span class="p">(</span><span class="s">'%H:%M'</span><span class="p">))</span>

    <span class="n">ax</span><span class="p">.</span><span class="n">set_xlabel</span><span class="p">(</span><span class="s">'Departure time'</span><span class="p">)</span>
    <span class="k">if</span> <span class="n">ax</span><span class="p">.</span><span class="n">get_ylabel</span><span class="p">():</span>
        <span class="n">ax</span><span class="p">.</span><span class="n">set_ylabel</span><span class="p">(</span><span class="s">'Arrival time'</span><span class="p">)</span>
</code></pre></div></div>

<p><img src="/images/2022-09-08-boston-nh-commute_files/2022-09-08-boston-nh-commute_10_0.png" alt="png" /></p>

<p>Looks like the two routes are basically the same. Given that I’ve learned my lesson about route 3 from my recent experience, and that I-93 is a much more pleasant drive, I’ll focus on that for the rest of this deep dive into the time warp. I’m also only looking at the maximum estimated time provided by Google, since we know from personal experience that even that maximum is often an underestimate.</p>

<div class="language-python highlighter-rouge"><div class="highlight"><pre class="highlight"><code><span class="k">def</span> <span class="nf">format_time_axes</span><span class="p">(</span><span class="n">ax</span><span class="p">):</span>
    <span class="n">ax</span><span class="p">.</span><span class="n">set_xlim</span><span class="p">([</span><span class="n">pd</span><span class="p">.</span><span class="n">to_datetime</span><span class="p">(</span><span class="s">'2022-09-08 04:30:00'</span><span class="p">),</span> <span class="n">pd</span><span class="p">.</span><span class="n">to_datetime</span><span class="p">(</span><span class="s">'2022-09-08 10:00:00'</span><span class="p">)])</span>
    <span class="n">ax</span><span class="p">.</span><span class="n">xaxis</span><span class="p">.</span><span class="n">set_major_formatter</span><span class="p">(</span><span class="n">mdates</span><span class="p">.</span><span class="n">DateFormatter</span><span class="p">(</span><span class="s">'%H:%M'</span><span class="p">))</span>
    <span class="n">ax</span><span class="p">.</span><span class="n">set_xlabel</span><span class="p">(</span><span class="s">'Departure time'</span><span class="p">)</span>
    <span class="n">ax</span><span class="p">.</span><span class="n">set_ylim</span><span class="p">([</span><span class="n">pd</span><span class="p">.</span><span class="n">to_datetime</span><span class="p">(</span><span class="s">'2022-09-08 06:30:00'</span><span class="p">),</span> <span class="n">pd</span><span class="p">.</span><span class="n">to_datetime</span><span class="p">(</span><span class="s">'2022-09-08 12:00:00'</span><span class="p">)])</span>
    <span class="n">ax</span><span class="p">.</span><span class="n">yaxis</span><span class="p">.</span><span class="n">set_major_formatter</span><span class="p">(</span><span class="n">mdates</span><span class="p">.</span><span class="n">DateFormatter</span><span class="p">(</span><span class="s">'%H:%M'</span><span class="p">))</span>
    <span class="n">ax</span><span class="p">.</span><span class="n">set_ylabel</span><span class="p">(</span><span class="s">'Arrival time'</span><span class="p">)</span>
    <span class="k">return</span> <span class="bp">None</span>        

<span class="k">def</span> <span class="nf">basic_scatter</span><span class="p">(</span>
    <span class="n">df</span><span class="p">,</span> <span class="n">x</span><span class="o">=</span><span class="s">'depart_datetime_nodate'</span><span class="p">,</span> <span class="n">y</span><span class="o">=</span><span class="s">'arrival_time_max_nodate'</span><span class="p">,</span>
    <span class="n">format_y</span><span class="o">=</span><span class="bp">True</span><span class="p">,</span> <span class="n">format_x</span><span class="o">=</span><span class="bp">True</span>
<span class="p">):</span>

    <span class="n">ax</span> <span class="o">=</span> <span class="n">sns</span><span class="p">.</span><span class="n">scatterplot</span><span class="p">(</span>
        <span class="n">data</span><span class="o">=</span><span class="n">df</span><span class="p">.</span><span class="n">query</span><span class="p">(</span><span class="s">'route == "93"'</span><span class="p">),</span> <span class="n">x</span><span class="o">=</span><span class="n">x</span><span class="p">,</span> <span class="n">y</span><span class="o">=</span><span class="n">y</span><span class="p">,</span>
        <span class="n">hue</span><span class="o">=</span><span class="s">'color'</span><span class="p">,</span> <span class="n">alpha</span><span class="o">=</span><span class="mf">0.5</span><span class="p">,</span>
        <span class="n">palette</span><span class="o">=</span><span class="p">{</span><span class="s">'red'</span><span class="p">:</span> <span class="s">'red'</span><span class="p">,</span> <span class="s">'green'</span><span class="p">:</span> <span class="s">'green'</span><span class="p">,</span> <span class="s">'orange'</span><span class="p">:</span> <span class="s">'orange'</span><span class="p">}</span>
    <span class="p">)</span>

    <span class="n">ax</span><span class="p">.</span><span class="n">legend</span><span class="p">(</span><span class="n">loc</span><span class="o">=</span><span class="s">'lower right'</span><span class="p">,</span> <span class="n">title</span><span class="o">=</span><span class="s">"Google's</span><span class="se">\n</span><span class="s">estimate</span><span class="se">\n</span><span class="s">color"</span><span class="p">)</span>

    <span class="n">format_time_axes</span><span class="p">(</span><span class="n">ax</span><span class="p">)</span>

    <span class="k">return</span> <span class="n">ax</span>

<span class="n">ax</span> <span class="o">=</span> <span class="n">basic_scatter</span><span class="p">(</span><span class="n">df</span><span class="p">)</span>

<span class="n">ax</span><span class="p">.</span><span class="n">fill_between</span><span class="p">(</span>
    <span class="n">x</span><span class="o">=</span><span class="p">[</span><span class="n">pd</span><span class="p">.</span><span class="n">to_datetime</span><span class="p">(</span><span class="s">'2022-09-08 05:30:00'</span><span class="p">),</span> <span class="n">pd</span><span class="p">.</span><span class="n">to_datetime</span><span class="p">(</span><span class="s">'2022-09-08 08:30:00'</span><span class="p">)],</span>
    <span class="n">y1</span><span class="o">=</span><span class="p">[</span><span class="n">pd</span><span class="p">.</span><span class="n">to_datetime</span><span class="p">(</span><span class="s">'2022-09-08 12:00:00'</span><span class="p">),</span> <span class="n">pd</span><span class="p">.</span><span class="n">to_datetime</span><span class="p">(</span><span class="s">'2022-09-08 12:00:00'</span><span class="p">)],</span>
    <span class="n">alpha</span><span class="o">=</span><span class="mf">0.1</span><span class="p">,</span> <span class="n">color</span><span class="o">=</span><span class="s">'orange'</span>
<span class="p">)</span>
</code></pre></div></div>

<div class="language-plaintext highlighter-rouge"><div class="highlight"><pre class="highlight"><code>&lt;matplotlib.collections.PolyCollection at 0x7fcf4773e160&gt;
</code></pre></div></div>

<p><img src="/images/2022-09-08-boston-nh-commute_files/2022-09-08-boston-nh-commute_12_1.png" alt="png" /></p>

<p>Basically, leaving home any time between 5:30 am and 8:30 am puts me in the Boston traffic time warp: a period of  unpredictable and highly variable traffic, when the trip can take a full hour more on a bad day than a good one. And despite Google’s conservative estimates of the badness of traffic (at least based on the color of the arrival estimates they provide), you can see that the worst times for traffic also fall within the time warp period.</p>

<p>We can look at the day-to-day variability using my favorite statistical method, eyeballing it (since each point is a day, it’s the vertical spread between points), or by calculating it directly:</p>

<div class="language-python highlighter-rouge"><div class="highlight"><pre class="highlight"><code><span class="c1"># Difference in max travel time between days
</span><span class="p">(</span><span class="n">df</span><span class="p">.</span><span class="n">groupby</span><span class="p">(</span><span class="s">'depart_time'</span><span class="p">)[</span><span class="s">'travel_time_max_minutes'</span><span class="p">].</span><span class="nb">max</span><span class="p">()</span>
 <span class="o">-</span> <span class="n">df</span><span class="p">.</span><span class="n">groupby</span><span class="p">(</span><span class="s">'depart_time'</span><span class="p">)[</span><span class="s">'travel_time_max_minutes'</span><span class="p">].</span><span class="nb">min</span><span class="p">()</span>
<span class="p">).</span><span class="n">reset_index</span><span class="p">(</span><span class="n">name</span><span class="o">=</span><span class="s">'max_and_min_days_delta'</span><span class="p">)</span>
</code></pre></div></div>

<div>
<style scoped="">
    .dataframe tbody tr th:only-of-type {
        vertical-align: middle;
    }

    .dataframe tbody tr th {
        vertical-align: top;
    }

    .dataframe thead th {
        text-align: right;
    }
</style>
<table border="1" class="dataframe">
  <thead>
    <tr style="text-align: right;">
      <th></th>
      <th>depart_time</th>
      <th>max_and_min_days_delta</th>
    </tr>
  </thead>
  <tbody>
    <tr>
      <th>0</th>
      <td>5:00 AM</td>
      <td>30.0</td>
    </tr>
    <tr>
      <th>1</th>
      <td>5:30 AM</td>
      <td>40.0</td>
    </tr>
    <tr>
      <th>2</th>
      <td>6:00 AM</td>
      <td>60.0</td>
    </tr>
    <tr>
      <th>3</th>
      <td>6:30 AM</td>
      <td>50.0</td>
    </tr>
    <tr>
      <th>4</th>
      <td>7:00 AM</td>
      <td>40.0</td>
    </tr>
    <tr>
      <th>5</th>
      <td>7:30 AM</td>
      <td>40.0</td>
    </tr>
    <tr>
      <th>6</th>
      <td>8:00 AM</td>
      <td>30.0</td>
    </tr>
    <tr>
      <th>7</th>
      <td>8:30 AM</td>
      <td>20.0</td>
    </tr>
    <tr>
      <th>8</th>
      <td>9:00 AM</td>
      <td>10.0</td>
    </tr>
    <tr>
      <th>9</th>
      <td>9:30 AM</td>
      <td>10.0</td>
    </tr>
  </tbody>
</table>
</div>

<p>During the Boston traffic time warp, your commute can differ by up to an hour depending on which day you leave. Outside of the time warp, though, it’s pretty consistent.</p>

<p>Taking this further - leaving on a bad day might get you to Boston at the same time as leaving a full hour later on a good day. (I’ll say it again: leaving at 7:30 am on a bad day means you arrive at the same time as leaving at 8:30 on a good day :sob: - think of the extra hour of sleep you could have had!!) You can see this because the worst arrival time for a given departure time is the same arrival time as the best arrival time for a departure time an hour later - in other words, the highest dot for a given departure time is at the same vertical level as the lowest dot for a departure time that’s an hour later.</p>

<p>Outside of the time warp, in contrast, travel time to Boston is quite stable at around max two hours. But within the time warp period, the max travel time to Boston can get up to 3 hours depending on the day of the week. And that’s not even counting accidents, road work, or whatever else Google can’t predict!</p>

<p>Let’s see if Google’s own estimates recapitulate the high variance during the time warp.</p>

<div class="language-python highlighter-rouge"><div class="highlight"><pre class="highlight"><code><span class="n">df</span><span class="p">[</span><span class="s">'delta_min_max'</span><span class="p">]</span> <span class="o">=</span> <span class="n">df</span><span class="p">[</span><span class="s">'arrival_time_max_nodate'</span><span class="p">]</span> <span class="o">-</span> <span class="n">df</span><span class="p">[</span><span class="s">'arrival_time_min_nodate'</span><span class="p">]</span>
<span class="n">df</span><span class="p">.</span><span class="n">query</span><span class="p">(</span><span class="s">'route == "93"'</span><span class="p">).</span><span class="n">groupby</span><span class="p">(</span><span class="s">'depart_datetime_nodate'</span><span class="p">)[</span><span class="s">'delta_min_max'</span><span class="p">].</span><span class="n">describe</span><span class="p">()[</span><span class="s">'mean'</span><span class="p">]</span>
</code></pre></div></div>

<div class="language-plaintext highlighter-rouge"><div class="highlight"><pre class="highlight"><code>depart_datetime_nodate
2022-09-08 05:00:00   00:36:00
2022-09-08 05:30:00   00:42:00
2022-09-08 06:00:00   00:54:00
2022-09-08 06:30:00   00:58:00
2022-09-08 07:00:00   00:52:00
2022-09-08 07:30:00   00:44:00
2022-09-08 08:00:00   00:40:00
2022-09-08 08:30:00   00:32:00
2022-09-08 09:00:00   00:30:00
2022-09-08 09:30:00   00:28:00
Name: mean, dtype: timedelta64[ns]
</code></pre></div></div>

<div class="language-python highlighter-rouge"><div class="highlight"><pre class="highlight"><code><span class="n">df</span><span class="p">[</span><span class="s">'delta_min_max_float'</span><span class="p">]</span> <span class="o">=</span> <span class="n">df</span><span class="p">[</span><span class="s">'delta_min_max'</span><span class="p">]</span> <span class="o">/</span> <span class="n">pd</span><span class="p">.</span><span class="n">Timedelta</span><span class="p">(</span><span class="n">minutes</span><span class="o">=</span><span class="mi">1</span><span class="p">)</span>

<span class="n">ax</span> <span class="o">=</span> <span class="n">sns</span><span class="p">.</span><span class="n">scatterplot</span><span class="p">(</span><span class="n">data</span><span class="o">=</span><span class="n">df</span><span class="p">,</span> <span class="n">x</span><span class="o">=</span><span class="s">'depart_datetime_nodate'</span><span class="p">,</span> <span class="n">y</span><span class="o">=</span><span class="s">'delta_min_max_float'</span><span class="p">,</span> <span class="n">alpha</span><span class="o">=</span><span class="mf">0.5</span><span class="p">)</span>
<span class="n">ax</span><span class="p">.</span><span class="n">set_xlim</span><span class="p">([</span><span class="n">pd</span><span class="p">.</span><span class="n">to_datetime</span><span class="p">(</span><span class="s">'2022-09-08 04:30:00'</span><span class="p">),</span> <span class="n">pd</span><span class="p">.</span><span class="n">to_datetime</span><span class="p">(</span><span class="s">'2022-09-08 10:00:00'</span><span class="p">)])</span>

<span class="n">ax</span><span class="p">.</span><span class="n">set_xlabel</span><span class="p">(</span><span class="s">'Departure time (A.M.)'</span><span class="p">)</span>
<span class="n">ax</span><span class="p">.</span><span class="n">xaxis</span><span class="p">.</span><span class="n">set_major_formatter</span><span class="p">(</span><span class="n">mdates</span><span class="p">.</span><span class="n">DateFormatter</span><span class="p">(</span><span class="s">'%H:%M'</span><span class="p">))</span>

<span class="n">ax</span><span class="p">.</span><span class="n">set_ylabel</span><span class="p">(</span><span class="s">'Difference between earliest</span><span class="se">\n</span><span class="s">and latest arrival times (minutes)'</span><span class="p">)</span>
</code></pre></div></div>

<p><img src="/images/2022-09-08-boston-nh-commute_files/2022-09-08-boston-nh-commute_18_1.png" alt="png" /></p>

<p>Yep, you can see that the range between the earliest and latest estimated arrival times that Google provides reflects the range we see when we look at the day-to-day variability in the latest arrival time. Google seems to have a narrower time warp though, with things really only getting dicey from 5:30 to 8 am. I’ve been caught by this before, flipping back and forth between different departure times the night before I have to head into Boston, simultaneously calculating how few hours of sleep I’m gonna get with the likelihood of there being traffic and my own confidence in Google’s optimistic estimates.</p>

<p>Ok great so the time warp exists, but that doesn’t solve my problem of still needing to drive into Boston sometimes.  Let’s say I’d like to arrive to work between 9:30 and 10:30 am, what does my commute look like then?</p>

<div class="language-python highlighter-rouge"><div class="highlight"><pre class="highlight"><code><span class="n">ax</span> <span class="o">=</span> <span class="n">basic_scatter</span><span class="p">(</span><span class="n">df</span><span class="p">)</span>

<span class="n">ax</span><span class="p">.</span><span class="n">fill_between</span><span class="p">(</span>
    <span class="n">x</span><span class="o">=</span><span class="p">[</span><span class="n">pd</span><span class="p">.</span><span class="n">to_datetime</span><span class="p">(</span><span class="s">'2022-09-08 04:30:00'</span><span class="p">),</span> <span class="n">pd</span><span class="p">.</span><span class="n">to_datetime</span><span class="p">(</span><span class="s">'2022-09-08 10:00:00'</span><span class="p">)],</span>
    <span class="n">y1</span><span class="o">=</span><span class="p">[</span><span class="n">pd</span><span class="p">.</span><span class="n">to_datetime</span><span class="p">(</span><span class="s">'2022-09-08 09:30:00'</span><span class="p">),</span> <span class="n">pd</span><span class="p">.</span><span class="n">to_datetime</span><span class="p">(</span><span class="s">'2022-09-08 09:30:00'</span><span class="p">)],</span>
    <span class="n">y2</span><span class="o">=</span><span class="p">[</span><span class="n">pd</span><span class="p">.</span><span class="n">to_datetime</span><span class="p">(</span><span class="s">'2022-09-08 10:30:00'</span><span class="p">),</span> <span class="n">pd</span><span class="p">.</span><span class="n">to_datetime</span><span class="p">(</span><span class="s">'2022-09-08 10:30:00'</span><span class="p">)],</span>
    <span class="n">alpha</span><span class="o">=</span><span class="mf">0.3</span><span class="p">,</span>
    <span class="n">color</span><span class="o">=</span><span class="s">'orange'</span>
<span class="p">)</span>

</code></pre></div></div>

<div class="language-plaintext highlighter-rouge"><div class="highlight"><pre class="highlight"><code>&lt;matplotlib.collections.PolyCollection at 0x7fcf47896be0&gt;
</code></pre></div></div>

<p><img src="/images/2022-09-08-boston-nh-commute_files/2022-09-08-boston-nh-commute_21_1.png" alt="png" /></p>

<p>Woof - on the absolute worst day, getting to Boston at 9:30 am means I’d have to leave at 6:30 am. But on the best day, I could leave at 7:30 am. To make the best use of my time and not get stuck in the time warp, I should really try to leave home at 8:30  or 9, which means I shouldn’t schedule anything important until after 11 am.</p>

<p>However, I usually end up leaving around 8 am because arriving at 11 am is a little bit too late and too disruptive to my workday. Leaving at 8 am is sort of the balance point for me where I’m comfortable gambling on it being a good day (and thus getting to Boston early enough to enjoy a leisurely coffee before my 11 am meetings), but not so early that if I get stuck in traffic I’ll be very annoyed at all the time I wasted. Also, two and half hours doesn’t feel too too bad for a commute in, but only because I don’t do it very often. From this analysis, though, it does seem like leaving at 8:30 am is probably a better bet - I don’t get to Boston that much later, but the day-to-day variability in my commute will be lower, thus leading to hopefully less frustration.</p>

<p>Anyway, I already mostly knew this - scheduling anything in Boston before 11 am is a gamble unless I’m willing to leave super early. I didn’t really realize just how early I’d need to leave - I would have guessed 6 am was fine but no, it’s 5 am or bust.</p>

<p>In conclusion, Boston morning traffic sucks and feels like a time warp, which the data confirms is a valid feeling to have. Google’s estimates are surprisingly optimistic, with the maximum arrival time corresponding best with my lived experience. (Note to self: ignore the earliest estimated time from now on). Also, Google thinks that Route 3 and I-93 are basically the same, but my experience shows that to not be true. Maybe Google needs to incorporate an “emotional frustration” parameter into their recommendation algorithm, which includes some weights related to the daily variability in the traffic as well as how well Google’s estimates actually perform. Finally, leaving between 5:30 and 9 am means that my commute is unpredictable and could potentially suck a lot. That means that trying to get into Boston between 7:30 and 10:30 am sucks, and I shouldn’t schedule any important meetings during that time period if I don’t want to have to leave super early. So long as my first meetings are after 11 am, 8:30 am seems to be the optimal time to leave, balancing the potential benefit of getting into Boston early enough to grab a coffee with the slight chance of hitting a bad traffic day and getting a little stuck in the time warp.</p>

<p>Next time, I’d love to do this analysis but stop just north of Boston and see what proportion of all this chaos is caused by the last 10 miles of the trip vs the other 60.</p>]]></content><author><name>Claire Duvallet</name><email>cduvallet@gmail.com</email></author><category term="portfolio" /><summary type="html"><![CDATA[Like many young adults our age, my partner and I did the classic pandemic move of fleeing the city and moving in with his parents. That’s how I discovered I actually really enjoy living in rural New Hampshire, and last December we officially moved in to our own place in southern New Hampshire.]]></summary></entry><entry><title type="html">Early startup employee lessons learned, part 2: coping with the coaster</title><link href="https://cduvallet.github.io/posts/2022/11/early-startup-employee-coping" rel="alternate" type="text/html" title="Early startup employee lessons learned, part 2: coping with the coaster" /><published>2022-11-25T00:00:00-08:00</published><updated>2022-11-25T00:00:00-08:00</updated><id>https://cduvallet.github.io/posts/2022/11/coping-with-the-coaster</id><content type="html" xml:base="https://cduvallet.github.io/posts/2022/11/early-startup-employee-coping"><![CDATA[<p>Sometime last year, an advisor told me that one of the most useful tidbits he’d gotten about being in a startup was that the “roller coaster” description of startups isn’t quite right - it’s not really that you go up and down and up and down. When a startup is growing, it’s that the highs are higher and the lows are lower. It’s less of a roller coaster, and more of a sine wave with increasing amplitude. 
Somehow, this comforted me.</p>

<h2 id="coping-with-the-coaster-sine-wave">Coping with the <del>coaster</del> sine wave</h2>

<p>As I wrote in <a href="/posts/2022/11/early-startup-employee-change">Part 1</a> of this series, the most important thing that helped me cope was recognizing that <strong>unless you’re the founder, you can’t change the company</strong>.
I encourage you to read Part 1 for more on this, but it’s worth reiterating because acknowledging one’s place within a growing company is a pre-requisite for any other coping strategy.
Acknowledging this truth helped me let go of the ways I had envisioned myself influencing our company and come to peace with our new growth, culture, and my role in it.
That said, I did pick up a few other strategies to help me cope with the emotional roller coaster/sine wave of being an early employee at an early-stage startup.
These strategies are what I’ll focus on in this post.</p>

<h2 id="focus-on-your-timeline">Focus on your timeline</h2>

<p>At the beginning of joining a startup, there are what feels like a million possible paths for the company to take.
But as the company grows, the options necessarily narrow as you strive find product-market fit and investors ask for focus and demonstrated impact.
It’s important to recognize these changes and change your perspective with them.
Otherwise, it’s easy to get stuck wishing that things would go a different way, but that route branched off a long time ago on the company’s <a href="https://en.wikipedia.org/wiki/Remedial_Chaos_Theory">timeline</a> and is no longer available as a realistic option.
It’s easy to give in to the FOMO and want to still be involved in or informed about every project, but that’s become physically impossible as projects have multiplied (for more on this, I highly recommend this popular <a href="https://review.firstround.com/give-away-your-legos-and-other-commandments-for-scaling-startups">“Letting go of your legos” post</a>).
Or it’s easy to find yourself wanting to do a job that simply doesn’t exist anymore in this version of the company.
Just like founders and CEO’s have to change their jobs every six months or so as the company needs different things from them, so do companies change what they need from early employees.
It’s important to recognize that and be ready to adapt.</p>

<p>One of the best parts of being an early employee is that you get to be part of exciting conversations full of wild ideas and big dreams of where the company could go.
But as the company grows, the people involved in those conversations change, and it’s very possible that you won’t be part of them anymore.
This was especially true for me, as my role became consumed by day-to-day operations as we experienced our hyper-growth in a newly-remote working world. 
It was hard to suddenly find myself so far from the big picture, big dreams conversations I’d been invited to before.
But it’s the founders’ jobs to dream - and like we mentioned in <a href="/posts/2022/11/early-startup-employee-change">Part 1</a>, if they don’t want or facilitate having you in there dreaming with them then there’s not much you can about it.
That means that if the company’s growth goes in a direction you don’t love or you start to see some changes in mission that you don’t agree with, it may be really difficult to process emotionally. 
In general, early employees likely feel the pain of the company’s shortcomings more acutely than other employees, because we were there from the start.
The pain of the delta between what could be and what is hurts us more, because we are more acutely aware of <em>all</em> the “what could have been’s.”</p>

<p>In the early stages of startup’s journey, all of the opportunities and timelines are still valid and available.
But as the company grows, both it and its early employees must choose between opportunities, picking individual timelines and starting to travel down them.
It’s important to not get stuck looking to your side at all the other parallel timelines you and your company aren’t on, because they’re not available - they branched off a long time ago, or were never available in this reality to begin with.
I’ve found that the best thing to do is to <strong>focus on the timeline you’re currently on</strong>, recognize its merits in addition to its shortcomings, and put efforts toward making <em>that</em> timeline the best it can possibly be.</p>

<h2 id="divest-from-the-mission-a-little">Divest from the mission (a little)</h2>

<p>One useful way I’ve found to cope with getting farther from the early stage dreams is to actually divest myself from them.
As startups grow, early employees go from being an integral contributor across all aspects of the company to just regular old employees.
From the company’s perspective, you go from being key and core element of its survival to just another cog in the machine.
So it helps to do the same, and change your attitude toward the company: from a key and core element of your life, to just another part of your participation in capitalism.
Recognizing that <strong>the job is just a job</strong> can be an important way to gain perspective and emotional distance from the sine wave.
Of course - it’s still a really great job, ideally with meaningful impact and opportunities for growth, but still a job nonetheless.</p>

<h2 id="update-your-comparators">Update your comparators</h2>

<p>When I’m feeling burned out or stressed, or if startup chaos is generally getting me down, I’ve found that recognizing that it almost certainly could be worse is actually a helpful coping mechanism.
Of course, the coping strategy assumes that you do like your work and the work your company is doing, that you enjoy working with most of your colleagues, and have a non-toxic relationship with your supervisor (or at least some combination of those features) - basically, that you do want to stick with this job but just have to figure out how to make it less emotionally draining.</p>

<p>As you grow and hire more people, ask about their horror stories!
(This is especially important if, like me, being an early employee at this company is one of your first jobs.)
When you vent to them about what’s going on, ask them to compare this situation to their prior experiences.
You might realize that your problems aren’t that unique after all, and hearing that can be really validating.
Or you might realize that what you’re experiencing is much worse than you thought, which could shed some important clarity on your situation.
You might also be surprised - this might be the best job they’ve ever had!
In any case, sharing horror stories can provide you with the perspective that while, yes, what you’re dealing with is difficult, <strong>it likely could be worse</strong>. 
I found that being constantly reminded of this made it much easier to deal with the hard stuff.</p>

<h2 id="focus-on-the-baby-steps">Focus on the baby steps</h2>

<p>One concrete strategy I’ve picked up which has helped me deal with situations where I’m frustrated about something that’s out of my control is to <strong>focus on the baby step, not the toddler step</strong>.
When something happens and I get grumpy because that thing could have been done so much better, instead of focusing on how it could be better (which is how things would be, if we were a toddler company), I try to focus instead of the fact that the thing was done at all (which is the first “baby” step we’re at).
For example, if the communication of an important announcement is botched, rather than focusing on how poor the communication was, I try to reframe and emphasize that the announcement was communicated at all!
Communicating <em>well</em> is the toddler step; communicating <em>at all</em> is the baby step I’m celebrating instead.</p>

<h2 id="avoiding-burnout">Avoiding burnout</h2>

<p>Burnout is real, and avoiding or managing it is critical to coping with the early employee startup rollercoaster.
For me, burnout hit early and it hit hard - I was operating at above 100% for over a year, and it’s taken me about the same amount of time to get back to a stable relationship with work.
As an early employee in a company experiencing hyper growth, I was a critical piece of so many different aspects of our business operations powering our growth, which I imagine is an experience shared by many early employees.
If there’s a foolproof way to avoid burnout, I don’t know it - but I have learned some strategies to process and recover.</p>

<p>First, <strong>recognize that you can only do so many jobs.</strong>
One of my colleagues had a mantra that I found extremely helpful: when she said no to something, or intentionally dropped the ball on something, or explicitly decided not to address a problem at work, she’d say: “I could do that, but then it would be a full-time job and I would die.”
When you put it that way, the choice is easy: don’t die.</p>

<p>Second, <strong>name all the jobs you’re doing, early and often</strong>.
As I emerged from my most severe burnout, I found that naming all the jobs I was doing (and very much half-assing) was really helpful.
For example, for most of 2022 I was a part-time group lead for one of our data science subteams in addition to being a technical lead, my “actual” job.
That meant that when I felt bad for not being good at my group lead role, I would remind myself: it’s just half of my job.
So as long as I’m doing it at least half as well as my colleagues, then that’s all we can ask for. 
Early on, this strategy of naming my jobs actually backfired - I would start writing down everything I did and then become overwhelmed with how many things there were and how impossible it all felt, and end up feeling worse than when I started.
But I think that if I had started naming my jobs before they piled up, it would have helped me keep tabs on my growing responsibilities, recognizing which jobs I was letting slide and which ones were critical and therefore needed to be hired for.
I think it would have also led to more productive conversations with my manager, helping me advocate for myself in more concrete ways than “I’m stressed, overworked, and burning out.”</p>

<p>This strategy feels obvious in hindsight but it took a while for it to set in for me: <strong>work intentionally and on your terms.</strong>
I’ve had slack off of my phone and the red notifications turned off on my desktop for about a year now, and it’s been life-changing for gaining back control of how I interact with work.
Next time I’m in a position where I feel that my company is heading into hypergrowth or I’m creeping toward burnout, I will immediately delete all of my after-work notifications and most of my in-work notifications too.
Being principled and intentional about whether and when to work after hours and working on your own terms within working hours is key for managing burnout as an early employee.
Of course, it’s important to communicate any changes in availability with colleagues so that they know how to reach you after hours if needed, since startups are unpredictable.
But otherwise, focus on strategies to hold yourself accountable to respecting after-work hours.
I wish I had removed my notifications much earlier, in part because I think it would have helped me get my mental health back much faster.
But equally importantly, I think it would have also made it much more clear to my executive leadership just how much work and tricky troubleshooting we were doing after-hours to keep our daily operations running.</p>

<p>I recognize that it’s really difficult to cut the cord in this way, and in fact it felt impossible for me at the time when I needed it most.
A huge part of the excitement of being an early employee is being involved in everything.
When things are going well at work, it’s fun to operate with a super flexible schedule like back in grad school.
And also like grad school, our identities are wrapped up in the work.
Furthermore, hustle culture tells us that we should be working all the time, which is resonates even more strongly as an early employee.
And in the case of a startup undergoing rapid growth, then it’s so exciting and nobody wants to miss a thing.
But to grow sustainably, startups have to improve their bus factors to not just rely on a handful of passionate early employees and instead grow to have fully functioning and appropriately sized teams.
Early employees play a huge role in this transformation, but it only works if we set boundaries and hold ourselves to them.
In fact, I believe that a key company milestone that nobody really talks about is achieving redundancy for early employees - the sooner you can get in the habit of not being critical, the sooner your company will get there.
So take a vacation, uninstall slack from your phone, close your laptop: remember, you’re actually doing your company a favor.</p>

<p><em>I hope these strategies and mantras are helpful if you are an early employee struggling with the emotional roller coaster of your experience. If you liked this post, check out the rest of the series on being an early startup employee:</em></p>
<ul>
  <li><em><a href="/posts/2022/11/early-startup-employee-change">Part 1: affecting change within your org</a></em></li>
  <li><em><a href="/posts/2022/11/early-startup-employee-coping">Part 2 (this post): coping with the emotional rollercoaster</a></em></li>
  <li><em><a href="/posts/2022/12/early-startup-team-growth-culture">Part 3: building a team culture</a></em></li>
  <li><em><a href="/posts/2023/02/early-startup-changing-role">Part 4: adapting to your changing role</a></em></li>
</ul>]]></content><author><name>Claire Duvallet</name><email>cduvallet@gmail.com</email></author><summary type="html"><![CDATA[Sometime last year, an advisor told me that one of the most useful tidbits he’d gotten about being in a startup was that the “roller coaster” description of startups isn’t quite right - it’s not really that you go up and down and up and down. When a startup is growing, it’s that the highs are higher and the lows are lower. It’s less of a roller coaster, and more of a sine wave with increasing amplitude. Somehow, this comforted me.]]></summary></entry><entry><title type="html">Early startup employee lessons learned, part 1: affecting change</title><link href="https://cduvallet.github.io/posts/2022/11/early-startup-employee-change" rel="alternate" type="text/html" title="Early startup employee lessons learned, part 1: affecting change" /><published>2022-11-19T00:00:00-08:00</published><updated>2022-11-19T00:00:00-08:00</updated><id>https://cduvallet.github.io/posts/2022/11/startup-lessons</id><content type="html" xml:base="https://cduvallet.github.io/posts/2022/11/early-startup-employee-change"><![CDATA[<p>The past two years have been a wild ride.
The startup I work for went from 5 employees to over 100, one small customer to a multi-million dollar contract with the CDC, one product to over 10, and one customer report per month to hundreds per day - it’s been a lot!</p>

<p>And I’ve learned a lot, but most of it has come the hard way.
The past two years have been among the most difficult in my life - yes, a large part of it was the pandemic and the acute experience of our public health systems failing us, but a large part of it was also work.
In order to support our company’s growth, a <em>lot</em> was put on my shoulders - getting out from under that weight, and learning to function in the new company we’ve become, has been a huge challenge.</p>

<p>Now that I’m in a good spot and able to reflect on the past two years, I’ve realized that there aren’t a whole lot of resources out there to support <strong>early employees</strong> on their startup journeys.
If you’re a founder, there are fellowships, accelerators, and communities that you can participate in that’ll teach you the nuts and bolts of founding a company <em>and also</em> give you a peek into the emotional rollercoaster you’re lining up for.
These networks provide you with a community of peers you can reach out to for support, and perhaps even equip you with some strategies to navigate the founder journey and make it less draining.</p>

<p>But I haven’t seen similar resources targeted for early employees and their experiences.
Googling “<a href="https://www.google.com/search?q=early+employee+startup">early employee startup</a>” brings up a handful of blog posts, but they’re primarily focused on strategies to maximize  work output and how joining an early startup is a great way to superboost your career growth.
If emotional management is mentioned at all, it’s as an aside: “oh, being an early employee is an emotional rollercoaster so make sure you’re ready to handle it. But also think of all the potential career growth!”
<em>How</em> to handle the journey isn’t discussed - and there’s even fewer resources if you don’t subscribe to the “work your ass off overtime, make your startup job your whole life” mentality.</p>

<p>Three years ago when I joined a startup as the fifth person on the team, I was naive and excited to have an outsized impact on an exciting woman-led company doing amazing work.
And, of course, intrigued by the opportunity to superboost my career growth.
But I now understand that I went into my job completely uninformed, swayed by all of the “joining a startup as an early employee is hard, but &lt;1000 word blog post about all the ways it can be amazing for your career&gt;” rhetoric.
As things got really hard as we scaled and went through deep growing pains, it hit home for me how little I’d known about what I was sighing up for. 
And I found that if you’re an early employee at a startup struggling to figure out how to scale with your company while maintaining your sanity and work-life balance, or if you’re already so burned out that you <em>can’t</em> keep hustling but you also don’t want to quit just yet, there doesn’t seem to be much out there for you.
(If there is, <em>please</em> point me to it!!)
So I wanted to write down some of the lessons I’ve learned.</p>

<p>I’ll caveat all of this with the requisite disclaimer that these are my personal experiences, and that things that work for me may not work for you.
Even within my own company, each early employee has taken a unique path, and likely learned different things from their journeys.
It’s also important to note that this is my first job out of grad school, and my founders were also fresh out of academia when they started the company.
So it’s possible that what I’m about to share is obvious for anybody who’s had a job before, but I also know there are a lot of people in my shoes - excited to take a chance and join a startup they’re passionate about right after finishing grad school.</p>

<p>This will be a multi-part series, starting with part 1 here which focuses on affecting change within an organization.
I’ll also touch on coping strategies for the roller coaster, things I’ve learned about building a team, and strategies I’ve picked up for hiring well and hiring fast.</p>

<p>Keep your arms and legs inside the ride at all times, folks - it’s gonna be bumpy!</p>

<h2 id="youre-an-employee-not-a-founder">You’re an employee, not a founder</h2>

<p>Building organizations is not something that humans have figured out yet. 
Unless you have exceptional founders (and even if you do), organizational and systemic failures will abound as your company grows.
This is especially true if you’re experiencing hyper growth - there’s just no way to grow that fast without dropping <em>some</em> balls related to company health. 
My company’s dropped balls with respect to organizational health and culture hit me especially hard.</p>

<p>What’s helped me cope is the realization that <strong>unless you’re the founder, you can’t change the company</strong>.
This has been <em>the most</em> important thing for me to internalize as I’ve navigated my company’s growth.
As the company grows, the founders decide everything, including how much impact non-founders can have on the company itself.
If they want to bring you in to large decisions where you have a seat at the table, great.
But if they don’t, there’s nothing you can do about it.
And that’s ok!
There are many valid phenotypes of founder, and at the end of the day the founders are the ones who decide what type of company they’re building.
You’re just an employee.</p>

<p>That said, you don’t have <em>zero</em> ability to affect change within your company, in fact you have quite a lot!
You just can’t make fundamental changes to the company as a whole, unless the founders are also actively on board.
I joined my startup in part because I was really excited to help shape the type of company we’d become.
When I realized that I wasn’t going to be able to exert influence on company-wide organizational culture, I really struggled.
If I’d known going into my job that “shaping the culture” is just as much of a gamble as “cash out big when we go public,” I think I would have struggled a lot less.</p>

<h2 id="focus-on-your-sphere-of-influence">Focus on your sphere of influence</h2>

<p>Being an early employee at a growing startup puts you at a really interesting nexus of influence.
On the one hand, your opinions have more weight than the average employee because of your long tenure and broad context.
On the other hand, folks with more seniority and different expertises are being hired above and around you, increasing the number of layers between you and the founders.
So making change goes from requiring just swiveling your chair to chat with the CEO sitting next to you to navigating a burgeoning hierarchy strategically and diplomatically.
For the first 6-12 months of our hypergrowth, I really struggled with this - I felt like I was wailing into the void about all the things that were wrong and that we needed to change, to no effect.
But as we’ve grown our team and hired some colleagues who are much more skilled diplomats than I am, I’ve picked up a couple of strategies to make change effectively in a growing organization.</p>

<p>Most importantly, <strong>the change you make must begin within your sphere of influence</strong> - the people and teams over whom you have influence, and not the ones outside your reach.
As an early employee, your sphere of influence is often the whole company.
But as the company grows, that changes - it becomes just your team and maybe also the team adjacent to yours, plus a few additional colleagues who you have strong relationships with.
It can be painful to see this dynamic and feel like your sphere of influence is shrinking - but it’s not!
Yes, you may go from having influence over 100% of the company to, say, 20% - which is a large number becoming smaller.
But actually, it’s highly likely that your sphere of influence goes 5 people to 25 - a 5x increase!</p>

<p>That’s what happened to me - in the early phases of our hypergrowth I maintained my influence over the majority of our growing company because I was handling so many aspects of our day-to-day operations.
The founders were the first to leave my sphere of influence, as they focused on capitalizing on this moment to supercharge our company’s growth.
As we grew, I had opinions on how our non-technical teams were growing, our market strategy, and so much more that I couldn’t do anything about - they were all things which I had no authority over and more importantly, were all under the purview of people outside my sphere of influence.
In contrast, our data science team is well within my sphere of influence.
Because of that, it was very easy for me to substantially shape our team’s culture, despite growing to almost 20 people.
In fact, our transparent, collaborative, and positive culture is my proudest professional achievement so far. :D</p>

<h2 id="change-starts-at-home">Change starts at home</h2>

<p>So does that make changing things outside your sphere of influence a mostly hopeless endeavor?
Well, yes and no - you probably can’t change big things directly, but you aren’t powerless to influence your organization.
That’s because <strong>grassroots efforts can lead to organizational impact</strong>.
Even though you can’t change how the whole organization works, doing something really well within your own little world can resonate more broadly.
It’s possible that other teams will become ready to tackle an issue that you’ve already solved, and come to you for inspiration or advice.
Alternatively, folks may notice aspects of your team functioning better than theirs, and reach out to learn how.
It can be less satisfying than directly wielding influence because you have to wait for other teams to be ready and in many cases to reach out, but that’s fine if it’s the best you can do.
You can’t force anyone to change who isn’t ready to, or convince anyone to listen to you who doesn’t want to.</p>

<p>My favorite grassroots effort that’s led to company-wide adoption is the data science team’s onboarding document, which has become the template for other teams’ onboarding. 
And our document was initially inspired by the simple existence of the software team’s onboarding document.
Our team also hosted a key cross-team training, which has become the model for inspiring other teams to think about formalizing their own cross-team interactions.</p>

<h2 id="influencing-teams-outside-your-sphere">Influencing teams outside your sphere</h2>

<p>When it comes to other teams that I’m not explicitly on, I’ve learned that making change is <strong>all about personal relationships</strong>.
Even if you’re not on a given team, having strong relationships with key individual can put them in your sphere of influence.
And if they then have influence over their team, then you can indirectly have influence through them.
Before we had siloed teams, my closest relationships were with folks who had started around the same time as me and my technical colleagues in software and data.
Now that we’ve grown to 100 employees with siloed teams, those relationships still carry the most impact and are the primary - and sometimes only - way I can influence other teams.</p>

<p>A concrete example of how I’ve learned to adapt my influence is our culture around async communication: I’m a big proponent of frequent public communication in slack channels, and of sharing unfinished work early and often.
(In fact, there’s a :surfacing: slackmoji made just for me!)
Other teams at my company have a different culture, and that used to frustrate me so much.
But I’m not in their team meetings, I’m not involved in hiring, and I don’t get a say in the culture they’re building - so it’s pointless to get upset or try to change it, when it’s so far outside my sphere of influence.
All I can do is slowly nudge folks in the direction of transparency through one on one conversations.
Over time, other teams have started making slack channels where they discuss their work publicly and open agenda notes that anyone can look to for async updates.
It’s been a slow process and very much a team effort, but I like to think that my one on one conversations have contributed slightly to that cultural change. 
On my team, in contrast, I explicitly ask about communication in interviews, collaboration is one of our team values, and we force folks to share unfinished work as part of onboarding.
As a consequence, the data science team is one of the most open and collaborative at our company.
But that’s because the data science team is as much in my sphere of influence as you can get - in fact, I helped write our team values and design our onboarding!</p>

<h2 id="timing-is-everything">Timing is everything</h2>

<p>Finally, <strong>timing is everything</strong> when it comes to making change in a growing organization.
Just because you have all the best ideas for how to grow a team or take your product to market doesn’t mean anything if the timing isn’t right.
Maybe there isn’t enough personnel and bandwidth to implement your idea, or you haven’t built up enough conviction for your idea among the right stakeholders, or maybe there’s just some external forces you don’t see holding progress back - if you keep hammering away at your idea in an unreceptive environment, you won’t get what you want and in the process you’ll drive yourself mad and likely frustrate your colleagues too.
This is especially important to recognize if you’re in a period of hypergrowth - there will be <em>so many</em> things that could be handled so much better, but it’s likely just so chaotic that folks are already at their max and doing the best they can.
It’s hard and it sucks, but you just have to be patient.
Luckily, there are so many things you can be doing right now - so it’s important to recognize when the timing isn’t right, and refocus your energy on things that you CAN achieve <em>in the current moment</em>.</p>

<p>So basically, figuring out how to make change at a growing organization is also a lot about all the ways you <em>can’t</em> make change in the organization.
But knowing what you can’t do is important to stop wasting energy on sysyphean tasks and instead refocus towards approaches that have a chance of achieving impact: starting small and biding your time, with the hopes that your local impact will ripple outwards and upwards to the rest of your organization.</p>

<p><em>If you liked this post, check out the rest of the series on being an early startup employee:</em></p>
<ul>
  <li><em><a href="/posts/2022/11/early-startup-employee-change">Part 1 (this post): affecting change within your org</a></em></li>
  <li><em><a href="/posts/2022/11/early-startup-employee-coping">Part 2: coping with the emotional rollercoaster</a></em></li>
  <li><em><a href="/posts/2022/12/early-startup-team-growth-culture">Part 3: building a team culture</a></em></li>
  <li><em><a href="/posts/2023/02/early-startup-changing-role">Part 4: adapting to your changing role</a></em></li>
</ul>]]></content><author><name>Claire Duvallet</name><email>cduvallet@gmail.com</email></author><summary type="html"><![CDATA[The past two years have been a wild ride. The startup I work for went from 5 employees to over 100, one small customer to a multi-million dollar contract with the CDC, one product to over 10, and one customer report per month to hundreds per day - it’s been a lot!]]></summary></entry><entry><title type="html">Finding free places to camp on a US road trip</title><link href="https://cduvallet.github.io/posts/2021/09/finding-free-campsites" rel="alternate" type="text/html" title="Finding free places to camp on a US road trip" /><published>2021-09-26T00:00:00-07:00</published><updated>2021-09-26T00:00:00-07:00</updated><id>https://cduvallet.github.io/posts/2021/09/finding-free-campsites</id><content type="html" xml:base="https://cduvallet.github.io/posts/2021/09/finding-free-campsites"><![CDATA[<p>My parents just bought an RV and asked me to help them find places to camp as they travel. I’m all about finding free campsites not just because it’s a cheap way to see the US, but more importantly because our public lands are a national treasure. Dispersed camping is an amazing way to truly get out in nature, explore beautiful places off the beaten track, and truly benefit from and bask in the natural beauty of the United States.</p>

<p>Dispersed camping is allowed on <a href="https://www.blm.gov/programs/recreation/camping">basically all BLM</a> and National Forest land, unless otherwise specified. When I was on my <a href="/travel/">road trip</a>, I learned how to find campsites. My general process was:</p>

<ul>
  <li>use google maps to find national forests, national monuments, or other conservation areas near where I was going</li>
  <li>google the name of the conservation area to get to its BLM or USFS site</li>
  <li>look to see if the site mentioned any actual campgrounds or specific areas for dispersed camping</li>
  <li>poke around on the site to find and download a geospatial PDF map of the area</li>
  <li>if that doesn’t work, look to other sources like <a href="https://freecampsites.net/">freecampsites.net</a> or apps (I used <a href="https://freeroam.app/">freeroam</a> during my trip, which was decent)</li>
</ul>

<p>The geospatial pdf’s are especially useful to have, since they’ll often show more detail about roads than google maps has and they work with GPS even when there isn’t service so you know where are you and where you’re going.</p>

<h2 id="example-1-sedona-az">Example 1: Sedona, AZ</h2>

<p>Let’s do an example! My parents are looking to spend two nights someplace near Sedona, AZ.</p>

<p>First step: google maps. Great news! Sedona has lots of green space nearby, an excellent sign.</p>

<p><img src="/images/2021/2021-09-camping-sedona.png" alt="sedona" /></p>

<p>Looks like Cococino National Forest is the closets, so let’s start with that one. Googling it takes me to the <a href="https://www.fs.usda.gov/coconino">forest’s site</a>, after which I can go find camping info under the “Recreation” section in the left side-bar.</p>

<p>Funnily enough, clicking on this gets me to a page that has information about a “Digital Travel Map,” which sounds intriguing. But clicking on the “Maps and publications” sidebar gets me to an empty page, womp womp. But sure enough, looks like that Digital Travel Map link takes you to a <a href="https://www.fs.usda.gov/detail/coconino/landmanagement/projects/?cid=stelprdb5356224">very useful page</a> where you can download GPS-enable pdf maps of the forest! Huzzah!</p>

<p>Actually, this map is one of the best outcomes of this type of search. The map itself is huge and has a lot of detail, including specific “dispersed camping” indications. I never <em>really</em> understood these because technically dispersed camping is allowed in all National Forests, but I always felt more comfortable camping along roads that were explicitly indicated for dispersed camping. From reading the FAQ on <a href="https://www.fs.usda.gov/detail/coconino/landmanagement/projects/?cid=stelprdb5356224">the page</a> where we got the Motor Vehicle Use map, it sounds like these roads are where you are allowed to drive <em>off the road</em> up to 300 feet in order to camp. I’m guessing that other roads allow dispersed camping, but that you just can’t drive off of them to go to your campsite. Given that my parents are gonna be in an RV and not a tent, these are probably their best bet.</p>

<blockquote>
  <p>Does this restrict where I may camp?  <br />
The MVUM does not restrict where visitors may camp on National Forest System lands. However, it does restrict where motor vehicles may be used for the purpose of camping. Use of motor vehicles away from designated roads for the sole purpose of camping is permitted on National Forest System lands up to 300 feet from the edge of a designated road where indicated by the MVUM’s “dispersed camping” symbol . Also, visitors may park alongside any designated road’s edge and walk to their campsite anywhere on National Forest System lands, except where specifically prohibited as indicated in closure orders. When parking along a designated road, drivers must pull off the travelled portion of the roadway to permit the safe passage of traffic.</p>
</blockquote>

<p>Anyway, honestly at this point the map is more than sufficient. If you wanted to be extra safe, you could do some cross-checking with google maps satellite view to pick the nicest spot but generally any of the forest service roads marked for dispersed camping will likely be good options.</p>

<p>Just for completeness, let’s also go see what the forest service has to say about campgrounds in this forest. Wow - this forest is well-described! The <a href="https://www.fs.usda.gov/activity/coconino/recreation/camping-cabins">camping page</a> has so much information about campsites as well as dispersed camping. I especially appreciate the “<a href="https://www.fs.usda.gov/Internet/FSE_DOCUMENTS/stelprd3839183.pdf">Sedona Dispersed Camping Guide</a>” pdf – it always made me feel so much better to see dispersed camping explicitly called out (though, of course, I always knew it was allowed).</p>

<h1 id="example-2-quartzsite-az">Example 2: Quartzsite, AZ</h1>

<p>My mom told me they also need to find a place to stop for the night around (or east of) Blythe or Quartzsite, AZ.</p>

<p>Again, first stop google maps. This one looks like it might be a bit harder to find spots – I see some green area around the river and then that brown box that’s the Kona Wildlife Refuge. Let’s check both out and see if we can find more info or maps.</p>

<p><img src="/images/2021/2021-09-camping-quartzsite.png" alt="quartzsite" /></p>

<p>First try, the Colorado River Reservation. Seems to be Indian Reservation Land, so probably won’t have any camping available. Let’s poke around their site for just a few minutes and confirm though. Sure enough.</p>

<p>Ok, back to google maps - looks like there’s some green <em>below</em> Blythe. Seems to be the <a href="https://www.fws.gov/refuge/cibola/">Cibola National Wildlife Refuge</a>. Nothing obvious about camping on their website, so I next googled the name of the refuge plus “camping”. I saw <a href="https://www.loveyourrv.com/cibola-national-wildlife-refuge/">some websites</a> saying that there should be dispersed camping, but I tend to poke around until I find an actual BLM or Forest Service page or map about the place.</p>

<p>So let’s put that on the backburner and keep going east, to the Kona Wildlife Refuge. Same story here, no clear indication of campgrounds or dispersed camping in this area.</p>

<p>This is a situation where I turn to the aggregator websites. Looks like freecampsites.net has <a href="https://freecampsites.net/#!%2833.43713,+-113.68553%29">a few options in this area</a>, so let’s go through them and see if any look good for my parents.</p>

<p>Clicking around the different free sites, the first thing I look for is if there’s anywhere that’s a BLM campground. Again, these just feel more legit and like less of a wildcard. Looks like there might be one, “<a href="https://freecampsites.net/#!7634&amp;query=sitedetails">Hi Jolly BLM</a>”. So my next step here is to google the campground name itself and see if I can find it on the BLM site. I didn’t ind anything on the BLM site, but the next best thing is there! Looks like there are photos of this site (e.g. on <a href="https://thedyrt.com/camping/arizona/hi-jolly-blm-dispersed-camping-area">this website</a>), with clear BLM signposts indicating that it’s a legit campsite. It doesn’t look like it’ll be particularly scenic, just a flat dirt parking lot with a bunch of RV’s, but given that my parents will just be passing through this is more than sufficient!</p>

<p>At this point, I would google this campsite and add a star on my google maps, zoom in to the map to see if I can tell if there are roads, and read up on the reviews and descriptions of the camp so I know where to go. That said, I always like to have a couple of options when I’m not equipped with a map of the area of I’m going to, so let’s look for at least one more.</p>

<p>Back to the freecampsites.net site, looks like there’s <a href="https://freecampsites.net/#!49093&amp;query=sitedetails">a spot</a> off of I-10 on Gold Nugget Road. The trick to finding these sorts of sites is to just google the road name that they’re talking about, read reviews, and look at pictures to get a sense for how sketchy or not it might be. In this case, it looks like Gold Nugget Road goes just off of I-10 and then meets up with it again. There are also a handful of reviews on the internet for this road, so I feel like it’s pretty legit.</p>

<p>If you wanted to be EXTRA sure, you could also always try to find the BLM map of the area directly. Avenza has a marketplace of maps, and while it can be a bit painful to find what you need there is often a BLM map of each area that’s available for download. Some maps on Avenza cost money, but all the BLM and Forest Service ones should be free. <a href="https://www.avenzamaps.com/maps/search.html?query=blm&amp;location_mode=suggest_input&amp;location=Quartzsite%2C%20AZ%2C%20USA&amp;sort=relevance&amp;price_max=&amp;is_bundle=0&amp;page=0&amp;debug=&amp;current_map_id=&amp;location_box=33.71121893994715%2C-114.1641689118964%2C33.61677483791469%2C-114.2698179600912&amp;vendor_ids=&amp;category_ids=&amp;activity_ids=&amp;merge_mode=v4&amp;debug_ids=">A search</a> for BLM maps near Quartzsite, AZ yields a few hits that seem to be what you’d need. The goal with these maps is to (1) have a map that works even if you don’t have service and (2) get some more information about the land you’re on. Some BLM land is interspersed with private land, which you don’t want to camp on. So having a map that clearly shows the public land is a great comfort and tool to have!</p>]]></content><author><name>Claire Duvallet</name><email>cduvallet@gmail.com</email></author><summary type="html"><![CDATA[My parents just bought an RV and asked me to help them find places to camp as they travel. I’m all about finding free campsites not just because it’s a cheap way to see the US, but more importantly because our public lands are a national treasure. Dispersed camping is an amazing way to truly get out in nature, explore beautiful places off the beaten track, and truly benefit from and bask in the natural beauty of the United States.]]></summary></entry><entry><title type="html">Resources for pivoting to public health data science</title><link href="https://cduvallet.github.io/posts/2021/01/public-health-resources" rel="alternate" type="text/html" title="Resources for pivoting to public health data science" /><published>2021-01-09T00:00:00-08:00</published><updated>2021-01-09T00:00:00-08:00</updated><id>https://cduvallet.github.io/posts/2021/01/public-health-data-science-resources</id><content type="html" xml:base="https://cduvallet.github.io/posts/2021/01/public-health-resources"><![CDATA[<p>About two years into my PhD, I realized that the field I actually wanted to be in was public health, not necessarily biological engineering. Around the same time, I also fell in love with coding and data science. That’s when I realized that combining public health and data science could be an ideal career path for my technical abilities and interests and my desire to have social impact. But immersed in the world of academia, at an institution without a school of public health, and with mentors who had all chosen routes in biotech or academia, it was really hard to learn more about my options for pivoting to a career in public health.</p>

<p>So I started to scrounge around and look for opportunities for a highly-trained technical person like me to pivot into public health and social impact. I never actually ended up pursuing any of these opportunities because my former labmate started <a href="www.biobot.io">Biobot Analytics</a>, which was an obvious career fit for me. But I know not everyone is lucky enough to have a unique opportunity like Biobot, and I’ve had a few folks over the years ask me about transitioning to public health and/or data science from a PhD. So I’ll excavate the list of links and resources I’ve accumulated, in the hopes that they are one day useful to someone. (Again, I didn’t actually apply to any of these (except the Luce), so I can’t speak to what they actually are.)</p>

<h2 id="public-health-fellowships">Public Health Fellowships</h2>

<h3 id="cdc-eis">CDC EIS</h3>

<p><a href="https://www.cdc.gov/eis/index.html">https://www.cdc.gov/eis/index.html</a></p>

<p>Epidemic Intelligence Service, 2-year fellowship for doctors (healthcare professionals and PhDs). You get placed in a CDC office (you don’t get a say in where you get placed, I think) and work on the front lines of epidemiological response.</p>

<p>From informational interviews and asking around, seems that EIS is pretty legit and prestigious in public health, and are a very common way for non-MPH’s to break into a career path at the CDC.</p>

<h3 id="cdc-fellowships">CDC Fellowships</h3>

<p><a href="https://www.cdc.gov/fellowships/full-time/index.html">https://www.cdc.gov/fellowships/full-time/index.html</a></p>

<p>CDC has a list of many fellowships for bachelor’s, master’s, and PhD-level candidates. Actually, now that I look through this again this is probably the best place to start.</p>

<h3 id="orise-fellowships">ORISE Fellowships</h3>

<p><a href="https://orise.orau.gov/internships-fellowships/index.html">https://orise.orau.gov/internships-fellowships/index.html</a></p>

<p>Fellowships across a broad variety of government agencies (including the CDC), available at the undergraduate, graduate, and postdoctoral levels.</p>

<h3 id="aphl-cdc-fellowships">APHL-CDC Fellowships</h3>

<p><a href="https://www.aphl.org/fellowships/Pages/About-the-Fellowship-Program.aspx">https://www.aphl.org/fellowships/Pages/About-the-Fellowship-Program.aspx</a></p>

<p>A few different types of fellowships available with the Association of Public Health Laboratories, including a mix of lab and computational fellowships. Looks like the fellowship descriptions vary slightly, but all involve some placement in a state, local, or federal public health laboratory to do real-world public health work.</p>

<h2 id="postdocs-with-a-public-or-global-health-focus">Postdocs with a public or global health focus</h2>

<h3 id="big-data-scientist-training-enhancement-program-bd-step">Big Data-Scientist Training Enhancement Program (BD-STEP)</h3>

<p><a href="https://www.va.gov/oaa/specialfellows/programs/sf_bdstep.asp">https://www.va.gov/oaa/specialfellows/programs/sf_bdstep.asp</a></p>

<p>Looks like this is a VA-sponsored fellowship that you can apply for at multiple locations (and presumably projects). Seems like a semi-generic postdoc, except that I imagine you have excellent access to cool VA data.</p>

<h3 id="fulbright-fogarty-fellows-in-public-health">Fulbright-Fogarty Fellows in Public Health</h3>

<p><a href="https://us.fulbrightonline.org/about/types-of-awards/fulbright-fogarty-fellowships-in-public-health">https://us.fulbrightonline.org/about/types-of-awards/fulbright-fogarty-fellowships-in-public-health</a></p>

<p>Looks like this is a public health-specific Fulbright.</p>

<h3 id="global-health-program-for-fellows-and-scholars">Global Health Program for Fellows and Scholars</h3>

<p><a href="https://www.fic.nih.gov/Programs/Pages/scholars-fellows-global-health.aspx">https://www.fic.nih.gov/Programs/Pages/scholars-fellows-global-health.aspx</a></p>

<p>12-month research fellowships in low- and middle-income countries, administered through Harvard, UC Berkeley, University of California Global Health Institute, UNC, University of Washington, and Vanderbilt. I’m guessing you apply directly through one of the participating institutions, and I imagine it’s a fairly generic postdoc fellowship.</p>

<h3 id="international-research-scientist-development-award-irsda">International Research Scientist Development Award (IRSDA)</h3>

<p><a href="https://www.fic.nih.gov/Programs/Pages/research-scientists.aspx">https://www.fic.nih.gov/Programs/Pages/research-scientists.aspx</a></p>

<p>Funding for a postdoc or junior faculty to do research in a low- or middle-income country.</p>

<h2 id="international-fellowships">International fellowships</h2>

<p>These aren’t public health-specific, but you can swing a pivot into a new field with these.</p>

<h3 id="luce-scholars">Luce Scholars</h3>

<p><a href="https://www.hluce.org/programs/luce-scholars/">https://www.hluce.org/programs/luce-scholars/</a></p>

<p>Not public health-specific, but how could I not include the best fellowship in the entire world? :)</p>

<p>The Luce Scholars program places you in a job in an Asian country for a year. No requirements beyond beyond smart and driven, having a degree from a qualified institution, being a US citizen under 30, and having had little to no exposure to Asia. If you get it, you can go work at a local public health agency or public health-focused NGO.</p>

<h3 id="princeton-in-asia">Princeton in Asia</h3>

<p><a href="https://piaweb.princeton.edu/about-us">https://piaweb.princeton.edu/about-us</a></p>

<p>Like the Luce but less competitive, more participants, and less well-paid. But also has a lot more options than the Luce: the Princeton in Asia program basically funds a bunch of internships all across Asia. Lots of public health options here.</p>

<p>From my experience in Cambodia, PIA is far less structured than the Luce (you’re basically just in an internship on your own) but you have more co-fellows in your country so it’s easier to find community.</p>

<h3 id="gates-foundation-global-health-fellows">Gates Foundation Global Health Fellows</h3>

<p><a href="https://www.gatesfoundation.org/Careers/Gates-Fellowships-FAQ">https://www.gatesfoundation.org/Careers/Gates-Fellowships-FAQ</a></p>

<p>Looks like the fellowship is currently on pause, but intended to relaunch by 2022.</p>

<h3 id="global-health-corps">Global health corps</h3>

<p><a href="https://ghcorps.org/">https://ghcorps.org/</a></p>

<p>Seems similar to Princeton in Asia in that there are many placements to choose from (only in Rwanda, Uganda, Malwai, and Zambia).</p>

<h3 id="fulbright">Fulbright</h3>

<p><a href="https://us.fulbrightonline.org/">https://us.fulbrightonline.org/</a></p>

<p>Of course, there’s always a Fulbright. I wasn’t ever interested in pursuing a Fulbright because you have to come up with your own project (and I’ve heard you get basically zero support while in-country), but it’s definitely an option for folks who already have a clear idea of what they want to do.</p>

<h2 id="data-science-fellowships-and-postdoc-funding">Data science fellowships and postdoc funding</h2>

<h3 id="data-science-for-social-good">Data science for social good</h3>

<p><a href="https://www.dssgfellowship.org/">https://www.dssgfellowship.org/</a></p>

<p>One of the first and most well-regarded data science for social good fellowships. Spend a summer working closely with governments and non-profits to apply data science to have real-world social impact. Not directly public health, but I’m sure many projects are health-related!</p>

<h3 id="ibm-social-good-fellowship">IBM Social Good Fellowship</h3>

<p><a href="https://www.ibm.com/ibm/responsibility/initiatives/IBMSocialGoodFellowship.html">https://www.ibm.com/ibm/responsibility/initiatives/IBMSocialGoodFellowship.html</a></p>

<p>From the website: “The IBM Social Good Fellowship is an opportunity for graduate students and postdoctoral scholars to develop their skills and develop data science solutions that benefit humanity.”</p>

<h3 id="bids-data-science-fellows-program">BIDS Data Science Fellows Program</h3>

<p><a href="https://bids.berkeley.edu/call-data-science-fellow-applications">https://bids.berkeley.edu/call-data-science-fellow-applications</a></p>

<p>Funding for a 2-year fellowship at the Berkeley Institute for Data Science (BIDS).</p>

<h3 id="columbia-data-science-institute-postdoctoral-fellowships">Columbia Data Science Institute postdoctoral fellowships</h3>

<p><a href="https://datascience.columbia.edu/research/postdoctoral-fellows/">https://datascience.columbia.edu/research/postdoctoral-fellows/</a></p>

<p>Looks like a generic postdoc fellowship to work with Columbia DSI faculty.</p>

<p>Also in general, lots of institutions are starting up data science institutes which usually come with data science-specific opportunities.</p>

<h3 id="schmidt-science-fellows">Schmidt Science Fellows</h3>

<p><a href="https://schmidtsciencefellows.org/">https://schmidtsciencefellows.org/</a></p>

<p>Kind of like the Luce, but if it were a postdoc and for scientists wanting to pivot to a different field.</p>

<h2 id="policy-fellowships">Policy fellowships</h2>

<h3 id="aaas">AAAS</h3>

<p><a href="https://www.aaas.org/programs/science-technology-policy-fellowships">https://www.aaas.org/programs/science-technology-policy-fellowships</a></p>

<p>The classic. AAAS Science Policy Fellowships are an excellent way to get hands-on experience working on science policy issues in the federal government. The congressional (legislative) fellowship supports two people each year to go work in the office of a member of Congress (my friend just finished it, she worked with Ed Markey!). The executive fellowship has a lot more openings, and there you can work in basically any federal agency.</p>

<h3 id="the-christine-mirzayan-science--technology-policy-graduate-fellowship-program">The Christine Mirzayan Science &amp; Technology Policy Graduate Fellowship Program</h3>

<p><a href="https://mirzayanfellow.nas.edu/Default.asp">https://mirzayanfellow.nas.edu/Default.asp</a></p>

<p>I actually know very little about this one, though from the website looks like it’s at the National Academies of Sciences, Engineering, and Medicine in DC and for only 12 weeks.</p>

<h2 id="other-federal-opportunities">Other federal opportunities</h2>

<p>Honestly, the best thing you can do is to sign yourself up for as many emails from federal agencies as possible.</p>

<p>I think once you enter into one agency’s email subscription management service, it’ll give you options to sign up to other agencies’ emails as well. I find it easiest to start with the <a href="https://tools.cdc.gov/campaignproxyservice/subscriptions.aspx">CDC emails</a> and go from there. NIAID and NIH emails have been mostly useful, but there is a whole treasure trove of federal agencies with intriguing sounding names!</p>

<p>These emails are a good way not only to get notified of potential cool opportunities (including data science!), but also just to better understand that landscape of federal agencies beyond the CDC.</p>

<h3 id="public-health-service-corps">Public Health Service Corps</h3>

<p><a href="https://www.usphs.gov/">https://www.usphs.gov/</a></p>

<p>Did you know that there is an official uniformed service corps in the US Public Health Service? This is the group that’s led by the Surgeon General. I have no idea what applying or working for the public health service corps entails, but it’s good to know it exists!</p>

<h3 id="data-science-at-the-nih">Data science at the NIH</h3>

<p><a href="https://datascience.nih.gov/workforce-development/fellowship-job-opportunities">https://datascience.nih.gov/workforce-development/fellowship-job-opportunities</a></p>

<p>Looks like there’s a handful of data science-related opportunities available through the NIH’s <a href="https://datascience.nih.gov/">Office of Data Science Strategy</a>.</p>

<h3 id="18f">18F</h3>

<p>https://18f.gsa.gov/join/</p>

<p>18F works with government at many levels to modernize their software development.</p>

<h3 id="us-digital-service">US Digital Service</h3>

<p>https://www.usds.gov/apply</p>

<p>Seems similar to 18F, but with a bit more emphasis on transforming existing tools and processes. <a href="https://eriemeyer.medium.com/so-you-want-to-serve-your-country-a-biased-guide-to-tech-jobs-in-federal-government-c2d3fd567af">This blog post</a> describes 18F as “build it / buy it” and USDS as “fix it”.</p>

<h3 id="presidential-innovation-fellows">Presidential Innovation Fellows</h3>

<p>https://presidentialinnovationfellows.gov/</p>

<p>“Embedded within agencies as “entrepreneurs in residence” for one year, our fellows bring the best of data science, design, engineering, product, and systems thinking into government.” The blog post <a href="https://eriemeyer.medium.com/so-you-want-to-serve-your-country-a-biased-guide-to-tech-jobs-in-federal-government-c2d3fd567af">above</a> describes this as “Try it”.</p>

<h2 id="job-boards">Job boards</h2>

<p>These job boards are for a mix of GovTech, political tech, public health, computational biology, and related.</p>

<ul>
  <li>
    <p>USAJobs (<a href="https://www.usajobs.gov/">https://www.usajobs.gov/</a>): federal government’s official employment site.</p>
  </li>
  <li>
    <p>US of Tech (<a href="https://www.usoftech.org/">https://www.usoftech.org/</a>): more IT and software development focused, US of Tech is trying to get skilled technical folks into government. Job and internship opportunities across a variety of agencies.</p>
  </li>
  <li>
    <p>Outer Join (<a href="https://outerjoin.us/">https://outerjoin.us/</a>): recently found this one. Not focused on anything government or public health, just generic data science postings. All are supposed to be remote-friendly.</p>
  </li>
  <li>
    <p>Progressive Data Jobs (<a href="https://www.progressivedatajobs.org/">https://www.progressivedatajobs.org/</a>): data science jobs in progressive and Democratic campaigns and organizations.</p>
  </li>
  <li>
    <p>Higher Ground Labs (<a href="https://jobs.highergroundlabs.com/">https://jobs.highergroundlabs.com/</a>): another job board for progressive tech</p>
  </li>
  <li>
    <p>Jobs That Are Left (<a href="https://groups.google.com/g/jobsthatareleft?pli=1">https://groups.google.com/g/jobsthatareleft?pli=1</a>): Google group email list for a bunch of jobs in progressive spaces. Majority of the jobs are to work on campaigns, but I’ve also seen quite a few interesting data science jobs come through this list.</p>
  </li>
  <li>
    <p>All Hands (<a href="https://www.all-hands.us/">https://www.all-hands.us/</a>): looks to be less of a job board and more of a recruiting site. You submit your resume to join the talent pool, and then they connect you to jobs? No idea how effective this is.</p>
  </li>
  <li>
    <p>Coding it Forward (<a href="https://www.codingitforward.com/">https://www.codingitforward.com/</a>): has an email list with weekly job drops. Focused a little more broadly than the other political tech ones, they focus on social impact and civic technology.</p>
  </li>
  <li>
    <p>Fast Foward Tech (<a href="https://www.ffwd.org/tech-nonprofit-jobs/">https://www.ffwd.org/tech-nonprofit-jobs/</a>): focused on tech nonprofits.</p>
  </li>
  <li>
    <p>IDD Jobs (<a href="https://iddjobs.org/">https://iddjobs.org/</a>): job board for fields related to infectious disease dynamics, which overlaps considerably with epidemiology and public health-relevant worlds.</p>
  </li>
  <li>
    <p>Code for America job board (<a href="https://jobs.codeforamerica.org/search">https://jobs.codeforamerica.org/search</a>): job board for Code for America, opportunities in public interest tech.</p>
  </li>
</ul>]]></content><author><name>Claire Duvallet</name><email>cduvallet@gmail.com</email></author><summary type="html"><![CDATA[About two years into my PhD, I realized that the field I actually wanted to be in was public health, not necessarily biological engineering. Around the same time, I also fell in love with coding and data science. That’s when I realized that combining public health and data science could be an ideal career path for my technical abilities and interests and my desire to have social impact. But immersed in the world of academia, at an institution without a school of public health, and with mentors who had all chosen routes in biotech or academia, it was really hard to learn more about my options for pivoting to a career in public health.]]></summary></entry><entry><title type="html">Racism as a public health crisis: how wastewater epidemiology fits in</title><link href="https://cduvallet.github.io/posts/2020/06/racism-public-health-wbe" rel="alternate" type="text/html" title="Racism as a public health crisis: how wastewater epidemiology fits in" /><published>2020-06-10T00:00:00-07:00</published><updated>2020-06-10T00:00:00-07:00</updated><id>https://cduvallet.github.io/posts/2020/06/racism-public-health-wbe</id><content type="html" xml:base="https://cduvallet.github.io/posts/2020/06/racism-public-health-wbe"><![CDATA[<p>Today is the <a href="https://www.particlesforjustice.org/">Strike for Black Lives</a> and a day to <a href="https://www.shutdownstem.com/">#ShutDownSTEM</a>. For white people like me, today is about recognizing and reflecting on the anti-Black racism in our society, and committing to specific actions toward ending white supremacy. One of my actions for today is to publicly reflect on how our work at <a href="www.biobot.io">Biobot Analytics</a> contributes to addressing – and potentially perpetuating – racism in public health.</p>

<p>I’ll be going through this excellent <a href="https://www.washingtonpost.com/opinions/racism-is-killing-black-people-its-sickening-them-too/2020/06/04/fe004cc8-a681-11ea-b619-3f9133bbb482_story.html">Washington Post opinion piece</a> by Dr. Michelle Williams (Dean of the faculty at the Harvard School of Public Health) and Jeffrey Sánchez (former MA State Rep and fellow at HSPH):</p>

<h2 id="racism-is-killing-black-people-its-sickening-them-too"><a href="https://www.washingtonpost.com/opinions/racism-is-killing-black-people-its-sickening-them-too/2020/06/04/fe004cc8-a681-11ea-b619-3f9133bbb482_story.html">Racism is killing black people. It’s sickening them, too.</a></h2>

<p>I read this the other day and saw that wastewater epidemiology has a role to play in essentially every issue brought up in the piece. I’ve been thinking about many of these issues for a while now, but haven’t ever written them down. Hopefully in doing so, I can plant the seed for new ideas or encourage existing ones to grow, sparking conversations within my own company and the broader wastewater epidemiology community.</p>

<h2 id="social-determinants-of-health-aka-racism">Social determinants of health (AKA racism)</h2>

<blockquote>
  <p>Across the country, black Americans suffer from higher rates of diabetes, hypertension, asthma and heart disease than white Americans. They are more likely to be obese and get insufficient sleep, which can contribute to such health issues. The role of racism in these underlying conditions cannot be denied.</p>
</blockquote>

<blockquote>
  <p>A growing body of literature shows that social determinants — otherwise known as the conditions in which we’re born and in which we live, work and play — are key drivers of health inequities. For generations, communities of color have faced vast disparities in job opportunities, income and inherited family wealth. They are less likely to have housing security and access to quality schools, healthy food and green spaces. All these factors undoubtedly undermine mental and physical well-being.</p>
</blockquote>

<p>One of the most impactful aspects of looking to sewage as a source of health information is that everybody pees. Regardless of access to healthcare, economic opportunity, education level, or anything else – everybody pees. And if you’re like one of the majority of Americans who is connected to sewage infrastructure, then the health information you flush down the toilet is accessible through city sewers. That means that we can use sewage to monitor the health of people who might not have access to healthcare for any variety of reasons, and who therefore aren’t traditionally captured in clinical statistics.</p>

<p>Many crucial social determinants of health are difficult to quantify and therefore study. One of the other things that I find so exciting about wastewater epidemiology is that you could use it to measure these factors and open up new avenues of research and evidence-based policy making. For example, using wastewater to monitor community-level nutritional intake could change the way we identify and study food deserts, and directly quantify the impact of fresh food programs on the local communities who are intended beneficiaries.</p>

<h2 id="racism-associated-stress-and-its-biological-consequences">Racism-associated stress and its biological consequences</h2>

<blockquote>
  <p>In addition to the consequences of structural racism, it is well-documented that racism itself is hard on a person’s health. Chronic stress caused by discrimination can trigger a cascade of adverse health outcomes, from high blood pressure and heart disease to immunodeficiency and accelerated aging. Evidence even suggests that the racism endured by black mothers contributes to the alarmingly high maternal and infant mortality rate.</p>
</blockquote>

<p>As a bioengineer, it’s wild that my training never covered the biological effects of racism-induced stress compounded over a lifetime. There is certainly a <a href="https://www.npr.org/sections/health-shots/2017/11/11/562623815/scientists-start-to-tease-out-the-subtler-ways-racism-hurts-health">large body of research on health issues linked to racism-related stress</a>, but a disproportionate amount of biomedical science is focused on finding genetic markers to explain different rates of disease in sub-populations like racial groups. That had always annoyed me as a scientist uninterested in human genetics, but even more so when I realized that there was this whole other body of research that our field could have been prioritizing instead. And when you zoom in on <a href="https://www.hsph.harvard.edu/magazine/magazine_article/america-is-failing-its-black-mothers/">how these stressors affect health outcomes for Black mothers</a> in this country, the tragedy really crystallizes.</p>

<p>What if we measured biological markers of stress at a community-level through sewage? We could use wastewater epidemiology to show the extent of the biological impact of racism, for example by comparing stress markers in heavily policed communities vs. those with community-led neighborhood watches. Maybe sewage could open up a whole new field of research, directly measuring the biological effects of our racist and unjust society, and paving the way for improvements that rectify and reverse these negative impacts.</p>

<h2 id="essential-workers-and-unequal-access-to-economic-opportunity-and-public-health-prevention">Essential workers and unequal access to economic opportunity and public health prevention</h2>

<blockquote>
  <p>Black and brown Americans make up a disproportionate number of essential workers who have stayed on the job through lockdowns, and thus are at higher risk of contracting the disease. And when they do fall ill, they are more likely to receive worse care than white Americans do. That’s true even when controlling for socioeconomic factors such as income and education.</p>
</blockquote>

<p>The burden of COVID-19 is <a href="https://furmancenter.org/thestoop/entry/covid-19-cases-in-new-york-city-a-neighborhood-level-analysis">not evenly distributed</a>, and neither is the ability to implement preventative measures like staying home from work. That’s resulted in extremely disparate impacts, with Black people and other communities of color bearing a much greater share of COVID-19 deaths than their distribution in the population.</p>

<p>Here again, wastewater epidemiology could provide a quantitative and direct way to measure and monitor these disparities. By moving measurements upstream and into city manholes, we could identify new surges of COVID-19 on a community-by-community basis, mobilize testing centers to the areas where they are most needed, and make sure that even if certain communities aren’t being tested, they are being counted and served.</p>

<p>And it’s not just COVID-19 where this line of reasoning applies: with opioids, we’ve also realized that wastewater monitoring could be leveraged to identify communities who are experiencing high levels of opioid use and even overdoses (determined by measuring Narcan, the overdose reversal treatment) but who aren’t calling first responders and therefore have very low overdose numbers captured in official statistics. Thinking about quantifying these sorts of “treatment gaps” through wastewater could provide public health and city officials with yet another tool to address disparities within their local communities.</p>

<h2 id="environmental-racism">Environmental racism</h2>

<p>Environmental racism is another topic that I’m baffled was never covered in any of my scientific training. Across the country, low-income communities of color are more likely to have <a href="https://projects.propublica.org/louisiana-toxic-air/">factories</a> and <a href="https://texashousers.org/2019/03/21/study-black-latino-pollution-consumption-exposure/">other sources of pollution</a> built near them, further exacerbating health disparities. The disproportionate exposures to pollution faced by low-income communities of color are not passive mistakes, but rather the result of a systemically racist society.</p>

<p>This is another area where I’m excited by the potential of wastewater epidemiology to contribute to how these issues are studied, monitored, and improved. For example, measuring biomarkers of exposures to pollutants could complement associative studies linking toxic exposures to long-term health outcomes in individuals living in or from communities most affected by environmental racism. Imagine if the EPA’s metrics controlling what factories are and aren’t allowed to dump in the water weren’t about how much the factories were dumping, but rather about the direct health effects they were having on nearby populations.</p>

<h2 id="wastewater-epidemiology-as-a-potential-tool-of-oppression">Wastewater epidemiology as a potential tool of oppression</h2>

<p>I’m excited about the prospect of sewage-based monitoring as a tool for  quantifying health inequities by directly measuring the biological impacts of racist systems on individuals and communities. But I recognize that as with all other emerging technologies, this one is not without risks.</p>

<p>Yes, we could use wastewater epidemiology to shine a brighter light on social determinants of health and establish direct links between socioeconomic conditions and health outcomes. But we could also use wastewater epidemiology to entrench stigma and justify inequitable policies. For example, you could imagine insurance companies using sewage-based indicators as “objective” measures of community health, and varying premiums based on which neighborhood you live in. I could absolutely see an argument being made that such sewage-derived metrics are “objective” measures free from bias and therefore legitimate to act on. But it is clear that such measures would just be thinly veiled proxies for existing inequities.</p>

<p>Yes, wastewater epidemiology could be used to highlight the shockingly high rates of COVID-19 in communities with many low-income, non-white essential workers. And it could be used as an early warning for reemergence of COVID-19 cases on college campuses, thus providing administrators with finer and more responsive control over when to implement control measures. Or it could be used to justify unsafe return-to-campus or return-to-work policies, wherein the absence of COVID-19 in the sewers would justify the “safety” of forcing workers back to work even if they do not feel safe doing so.</p>

<p>And finally, even though sewage-based monitoring has the potential to revolutionize how we monitor the health of the majority of Americans, there’s still a non-negligible portion of the population that is not serviced by sewers. As we advocate for additional federal funding to integrate wastewater-based monitoring into standard public health practice, we must recognize which populations will be excluded. Even in the US, <a href="https://www.al.com/news/2017/12/un_poverty_official_touring_al.html">sanitation</a> is <a href="https://www.montgomeryadvertiser.com/story/news/local/alabama/2018/07/06/story-first-series-ways-communities-addressing-rise-poverty-related-tropical-diseases-poor-sewage/754311002/">not a solved issue</a>. Those without access to sewer systems may also be those with the least access to public health services. Whether our work serves to increase these inequities or decrease them is up to us.</p>

<h2 id="making-change-goes-beyond-sewage">Making change goes beyond sewage</h2>

<p>Which brings me to my last point. At the end of the day, wastewater epidemiology isn’t going to solve any of these societal issues. Sewage isn’t going to tell us anything we don’t know: we don’t need wastewater epidemiology to know that racism is bad and that it contributes to health disparities. At its best, wastewater epidemiology will provide additional concrete evidence to motivate change and actionable metrics to quantify improvements. At worst, it will be deployed thoughtlessly and in ways that further entrench existing disparities. It’s up to us, the technology leaders and entrepreneurs working to integrate wastewater epidemiology into standard public health practice, to make sure that doesn’t happen.</p>]]></content><author><name>Claire Duvallet</name><email>cduvallet@gmail.com</email></author><summary type="html"><![CDATA[Today is the Strike for Black Lives and a day to #ShutDownSTEM. For white people like me, today is about recognizing and reflecting on the anti-Black racism in our society, and committing to specific actions toward ending white supremacy. One of my actions for today is to publicly reflect on how our work at Biobot Analytics contributes to addressing – and potentially perpetuating – racism in public health.]]></summary></entry></feed>